
Trend lines are typically angled either up or down, with the most common being an up trend (line angled up) or a down trend (line angled down). Trend line trading is therefore a valuable tool for all traders and investors, as they can help to identify both buying and selling opportunities.
In this article we will look at:
- What Is a Trend Line?
- Types Of Trend Lines
- How To Draw A Trend Line
- Drawing An Up Trend Line
- Drawing A Down Trend Line
- Correctly Using Trend Lines In Your Trading Analysis
- Using Price And Time Filters With Trend Lines
- What To Read Next
What Is a Trend Line?
A trend line is a straight line that connects two or more price points on a chart. They are a key part of technical analysis and are used to identify trends, gauge potential reversals, and set entry and exit points. Trend lines can be drawn using the high and low price points or using closing prices. When drawn correctly, they can be an extremely powerful tool for technical analysts and traders alike.
Types Of Trend Lines
When constructing a trend line, it is important to use at least two points, as this will provide a more accurate representation of the market’s direction. Trend lines can be upward-sloping (bullish) or downward-sloping (bearish) but can also be part of pattern trend lines, which can be horizontal or only have a modest slope, usually seen when markets are in a non-trend, consolidation phase.
Trend lines can be used on multiple timeframes and can be used to identify intraday, short-, intermediate and long-term market trends. This means that trend lines can be used by all types of traders, including scalpers, day traders, position or swing traders, plus longer-term traders or investors.
How To Draw A Trend Line
Before you draw a trend line, it is first necessary to establish the directional trend of the market. According to Dow theory, markets can either be in an up trend, a down trend or a sideways trend. Markets do not move in straight lines but in a series of peaks and troughs.
An up trend, according to Dow Theory, is defined by a series of sequentially higher highs and higher lows. A down trend, however, is a series of successively lower highs and lower lows. Where there is no discernible pattern in peaks and troughs, and the market is on an erratic consolidation, this is defined as a sideways trend.
Once you have established which trend a market is in, you can then start to draw trend lines.
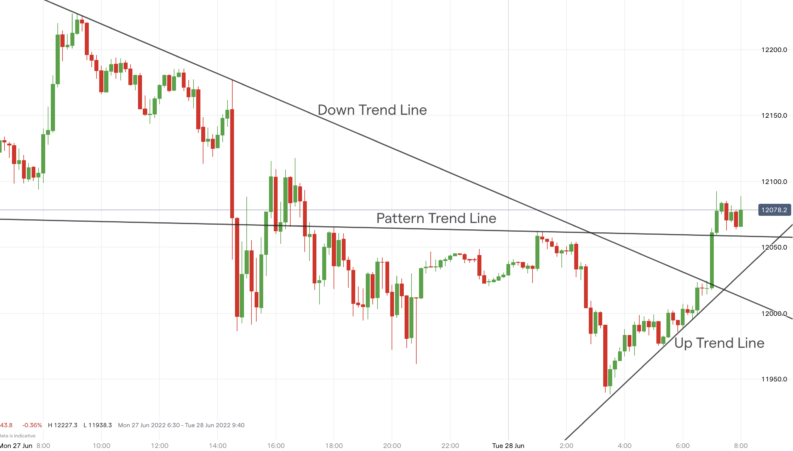
Source: IG
Drawing An Up Trend Line
A series of higher lows and higher highs signifies an up trend. To draw an upward sloping trend line on an up trend, it is necessary to draw a line connecting two consecutive higher lows. This is a first important step – up trend lines are defined by the connection of lows. So far this is very objective, but the subjectivity of drawing an up trend line comes when deciding which two lows to connect.
Usually, we would look to connect the first low in the trend, at which point the trend started, usually the turning point of the trend. This turning point may come after a prior down trend, or it may come from the start of a trend within a consolidation phase.
However, many times, the initial start of an up trend is quite impulsive, that is to say, it is marked by a forceful up move in a short time frame. This means that if trying to then join the first two lows from the up trend, the trend lines is often very steep. In turn, this trend line if often violated/ broken, even though the overall up trend remains intact and continues higher.
It is often better to draw an up trend line NOT off of the first and second lows of an up trend, but off of the second and third lows. By the time the second and third lows have been established, the trend are very often less steep – de facto more gradual than the initial, impulsive move from the start of the trend. Therefore, the trend line drawn between the second and third lows is more gradual and oftentimes a better reflection of the true up trend of the market.
Drawing A Down Trend Line
A series of lower lows and lower highs signifies a down trend. To draw a downward sloping trend line on a down trend it is necessary to draw a line connecting two consecutive lower lows and higher highs. This is a first important step – down trend lines are defined by the connection of highs. So far, this is very objective, but the subjectivity of drawing a down trend line comes when deciding which two highs to connect.
Usually, we would look to connect the first high in the trend, at which point the trend started, usually the turning point of the trend. This turning point may come after a prior up trend, or it may come from the start of a trend within a consolidation phase.
However, many times the initial start of a down trend is quite impulsive, marked by a forceful down move in a short time frame. This means that if trying to then join the first two highs from the down trend, the trend lines are often very steep. In turn, this trend line is often violated/broken, even though the overall down trend remains intact and continues lower.
It may be better to draw a down trend line NOT off of the first and second highs of a down trend, but off of the second and third highs. By the time the second and third highs have been established, the trend is very often less steep – de facto more gradual than the initial, impulsive move from the start of the trend. Therefore, the trend line drawn between the second and third highs is more gradual and oftentimes a better reflection of the true down trend of the market.
Correctly Using Trend Lines In Your Trading Analysis
Once you have successfully drawn your trend lines, the challenge is then to use these successfully in your trading. One of the first criticisms of trend lines is that any two points – two lows in an up trend or two highs in a down trend – can be joined to show a straight line that can be deemed a trend line (up or down). Therefore, technical analysts and traders often look for the ‘mythical’ third touch point for a trend line, meaning that the trend line is only valid once the price touches the trend line for a third time (a new swing low in an up trend or swing high in a down trend) and then continues the underlying trend.
However, the ‘mythical’ third touch point for a trend line often does not occur, and therefore, the trader is left unsure as to whether the trend line is, in fact, valid.
The key reason for using trend lines is that the trend line represents the rate at which the market price is rising or falling over time. The trend line slope mathematically represents price increase divided by time. When the market breaks the trend line, it is signalling that the bulls in an up trend or the bears in a down trend are no longer willing to step in and buy or sell the market on each swing at the same ‘rate’.
So rather than looking for the ‘mythical’ third touch point for a trend line, it is often better to check if the market is ‘respecting’ the trend line. This can be achieved in three ways:
- We get the ‘mythical’ third touch point on the trend line, validating the trend line. As we have stated and as experience shows us, this does not occur that often.
- The market moves towards the trend line, then does NOT actually touch the trend line, but comes ‘close’ to the trend line, ‘respects’ the trend line, then moves away, often impulsively. This is a validation of the trend line, as it shows market price. Therefore the market participants have respected the presence of the trend line.
- The market moves to and ‘just’ through the trend line, therefore breaching/violating/ reversing the trend line. But then moves back above (for an up trend) or below (for a down trend) the trend line, again, often impulsively. Even though the trend line has been broken, given the breach is not aggressive, that is, the market does not move ‘decisively’ through the trend line, then the market undoes the violation. This again can be viewed as a validation of the trend line, as it shows market price. Therefore, the market participants, have again respected the presence of the trend line. In this circumstance, critical is the amount by which the price moves ‘just’ through the trend line – with the ‘just’ being the key, subjective part of this equation. This brings us to our next point about trend lines, which is using a price or time buffer/ filter with the use of trend lines.
You can see examples of these in the chart below and also of drawing a down trend line off of the second high in the down trend.
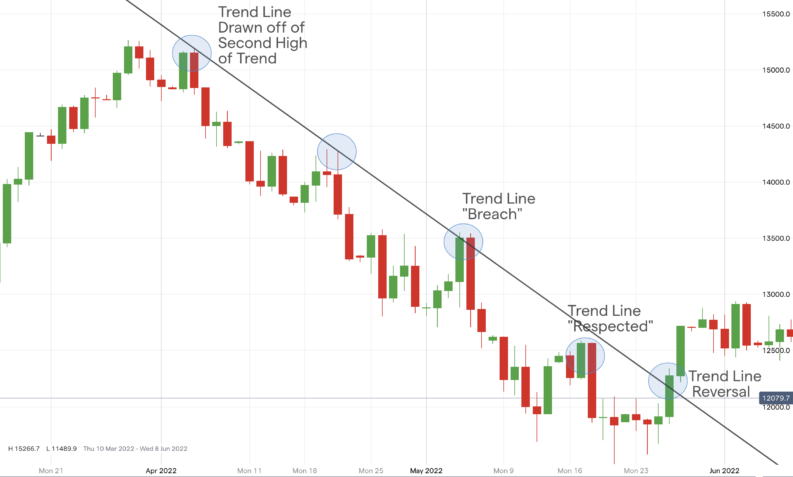
Source: IG
Using Price And Time Filters With Trend Lines
A key point we have brought up above is the use of price or time filters (also known as buffers) when using trend lines. We described how a market might initially ‘breach’ a trend line. This is the move back through the trend line to effectively leave the trend line ‘intact’, even having ‘broken’ the trend line.
The key here is that a price or time filter has been used to say, how much of a violation of the trend line, as a support or resistance is required to signal a ‘true’ reversal of the trend line. This may be by an absolute amount in price, it could be by a percentage amount of price, it could be for a certain amount of time, or a combination of these.
As with the use of any filter when looking at the break of support or resistance, the size of the price or time filter is extremely subjective, with the best results only discovered by testing with a trader’s own strategy.
What To Read Next
We trust you have learnt some new aspects about trend lines, how to draw them correctly and how to better use them in your trading. We have a further trend line strategy guide in our post Trendline Trading Strategy – Guide & Examples, so check out this and our other uses of technical analysis in your trading below.