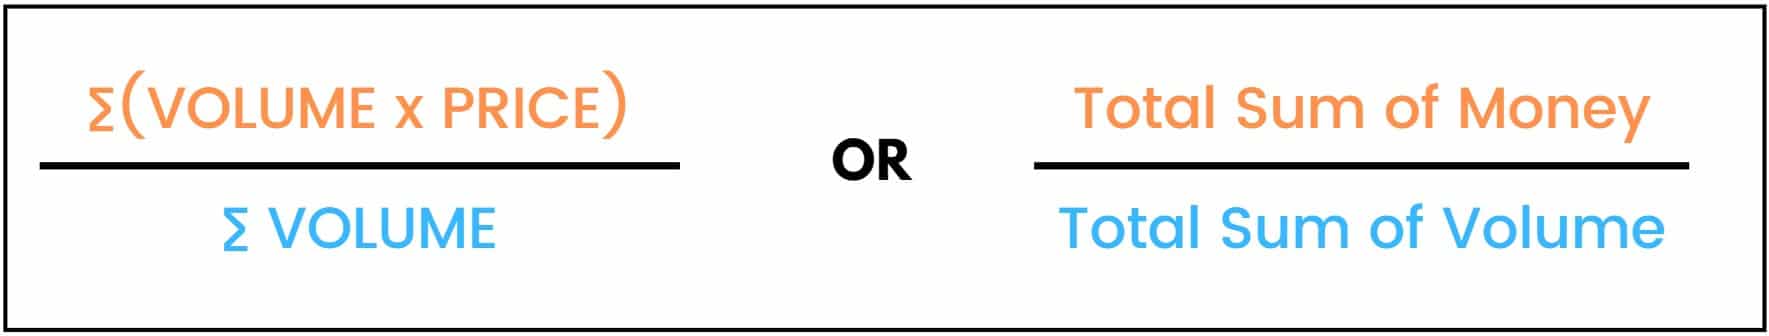
Mathematically, VWAP is the total amount of money transacted during some period divided by the total amount of volume that traded over the same time frame.
VWAP represents the market’s true Average Price over the plotted length of time, most commonly the entirety of a trading day.
Institutional Use
Originally utilized by institutional trading firms in the mid-1980’s as an execution benchmark, VWAP gauges the desirability of a position accumulated on behalf of a client (preferable buys below and sales above) as a critical, objective reference point.
Fulfilling sizable orders without impacting the market requires several smaller transactions over the course of the acquisition time frame. The position’s average price is then compared to the market’s average price (VWAP) to assess its quality.
Spearheaded by technological development, the use of VWAP has evolved over time. Institutions have largely turned to automated execution and supplementary algorithms in lieu of hand traders, but VWAP remains as crucial as ever.
Core Concepts
1. VWAP is cumulative from an event; most technical analysis is periodic over a recent number of candles.
Think of each chart as a portrait drawn candle by candle. Imagine if you could only see the last 9, 20, or 50 brushstrokes made by the artist, while everything before that disappears from view as they continue painting.
This is the problem with periodic indicators. Data from beyond the arbitrary look-back period you’ve selected (9ema, 20sma, etc.) is no longer factored into the calculation, leaving you with an incomplete picture of the market.
VWAP’s cumulative nature allows you to see the painting develop over the course of the day while factoring in each candle. No piece of data gets left behind, as each transaction that has occurred should factor into how you interpret the current state of the market and what’s most likely to happen next.
2. VWAP isn’t susceptible to changes in type, length, nor timeframe — unlike moving averages.
In addition to providing increased context, the cumulative calculation of VWAP prevents confusion regarding selected chart time frames and indicator settings that exist in nearly every other piece of technical analysis.
It doesn’t matter if you use a 1-minute chart, an hourly chart, or anything in between. There is only one intraday VWAP. Flipping between time frames will affect the granularity at which you can see VWAP behavior, but the calculation remains constant.
The same can’t be said for periodic indicators, where a 20-period moving average on a 1-minute chart will often look drastically different than it would with any other aggregation period.
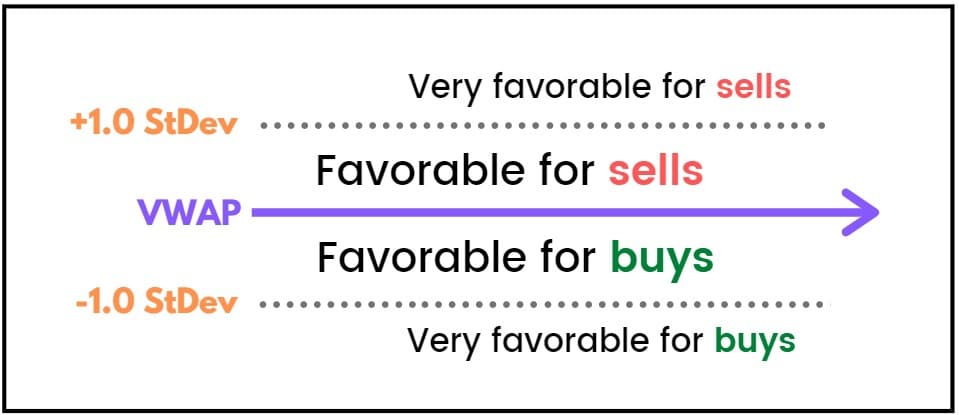
3. VWAP is a magnet, either attracting or repelling. Identifying the prevailing market style — towards or away from VWAP — should be your main objective.
There’s an oft-repeated myth about VWAP which is that price is ALWAYS attracted to VWAP — this is not the case! Such interpretation leads to an oversimplified approach of shorting stocks that trade too far above VWAP and buying those that fall too far below, with the expectation that a reversal is imminent.
If this were true, we’d never witness sustained trends. The more nuanced reality is that price can either be drawn towards VWAP or actively repelled from it.
Trading the magnetism of VWAP — rather than merely the direction (long or short) of a chart — is a more sophisticated objective. If you’ve ever been aligned with the direction of the market but became frustrated when a breakout consolidates (or vice versa), you’ve experienced such magnetic ‘misalignment’.
Useful Pages:
Compare Stock Brokers | Compare Forex Brokers | Compare CFD Brokers
4. VWAP has inertia: a tendency to continue whatever it’s currently doing.
By giving volume equal weight in its calculation, VWAP is intuitively more responsive to price movements on significant volume versus those with less money behind them. As VWAP absorbs more price and volume data over time, it becomes more resistant to random oscillations and sudden shifts. This allows it to accurately reflect only meaningful changes in a market’s value, bolstering its credibility as a reliable reference point.
We consider this the inertia of VWAP, where its resistance to change makes it significantly more reliable than short-term indicators spitting out a new buy/sell signal every couple of minutes. When VWAP does respond to market movement by sloping or trending, traders should pay attention.
Event Driven Averages
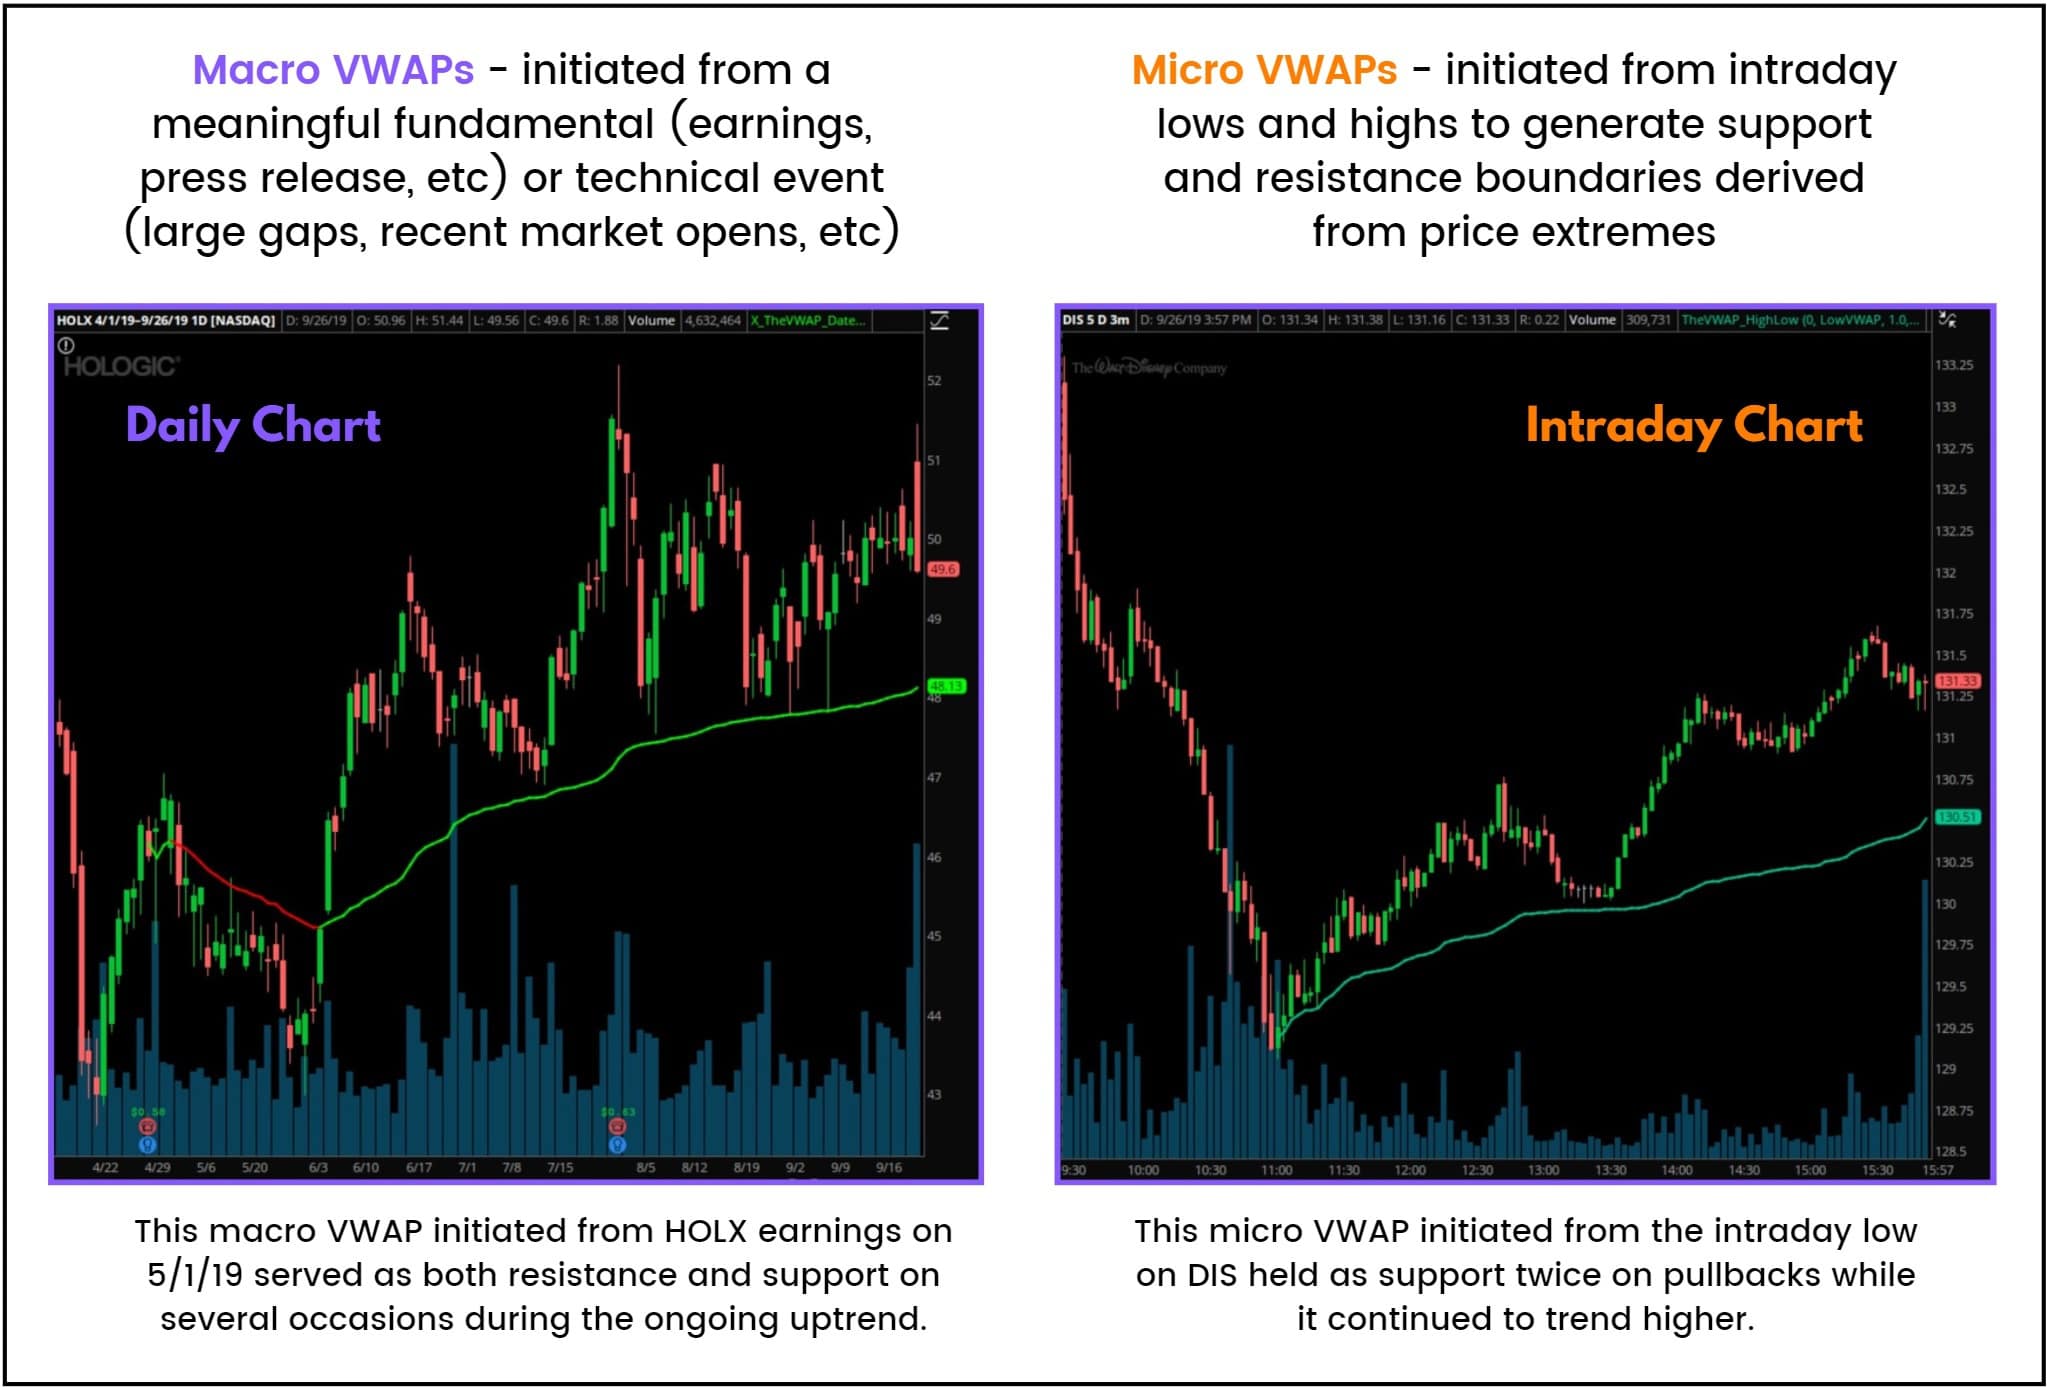
The underlying idea behind VWAP is the launching of a cumulative, volume-weighted average from an anchored starting point. All effective VWAPs are initiated at a significant event that should indicate an expected shift in market behavior, representing the continuous average price from that moment.
Though most commonly known as a single-day indicator plotted from market open to market close, VWAP is applicable to longer (multiday) and smaller (intraday) durations.
We tend to view the world through significant events rather than periodic lookbacks, so why not apply the same approach to our technical analysis? You wouldn’t ask your friends “how have you been for the last 20/50/100 days?”, so don’t do the same to the chart you’re analyzing.
Event driven averages makes it easier for us to relate to the chart, framing the data as a story rather than a series of random numbers.
Standard Deviation Bands
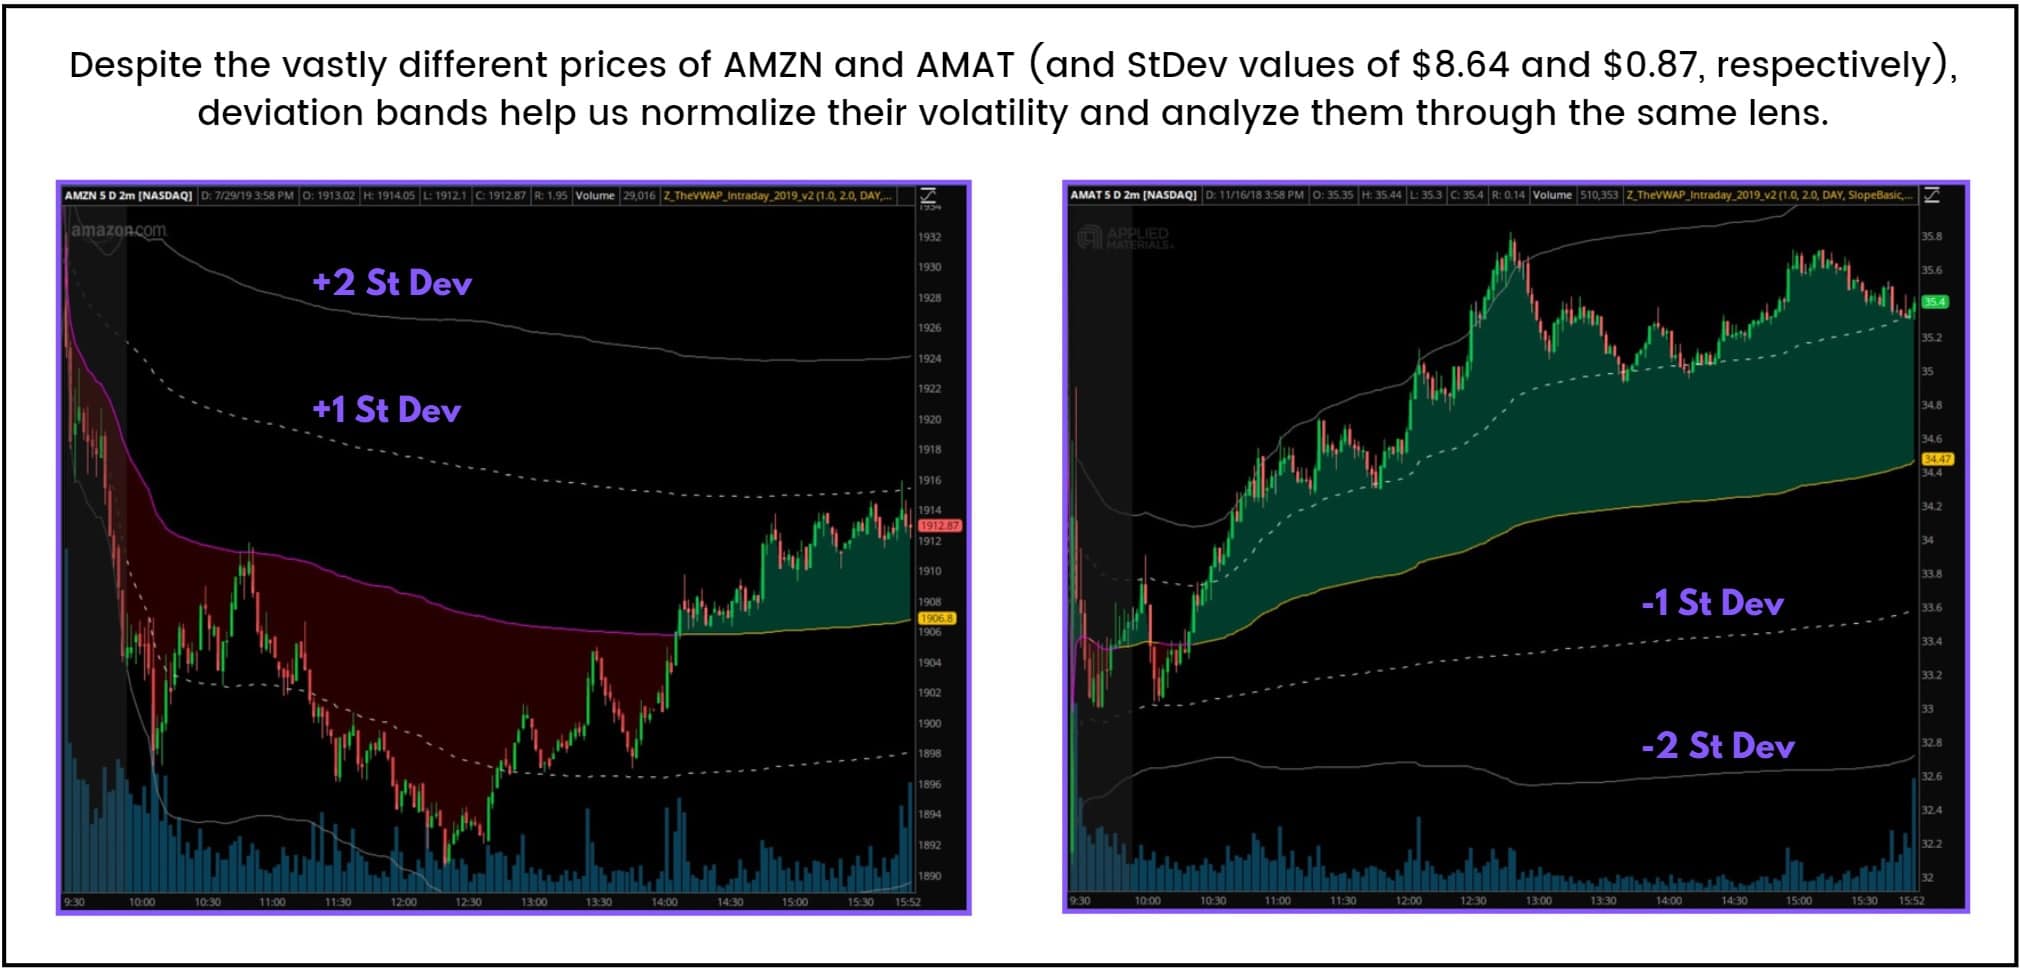
Without a metric to determine chart position relative to VWAP, our only evaluation method — are we above or below? — is drastically oversimplified. Standard deviations are an objective statistical measurement that quantify variance in a data set, with a small value indicating that most data points are close to the average and a larger value indicating a wider spread. By applying this tool to trading with VWAP serving as our average, we can plot these deviations as bands to create a visible unit of measurement to characterize market movement and gauge volatility.
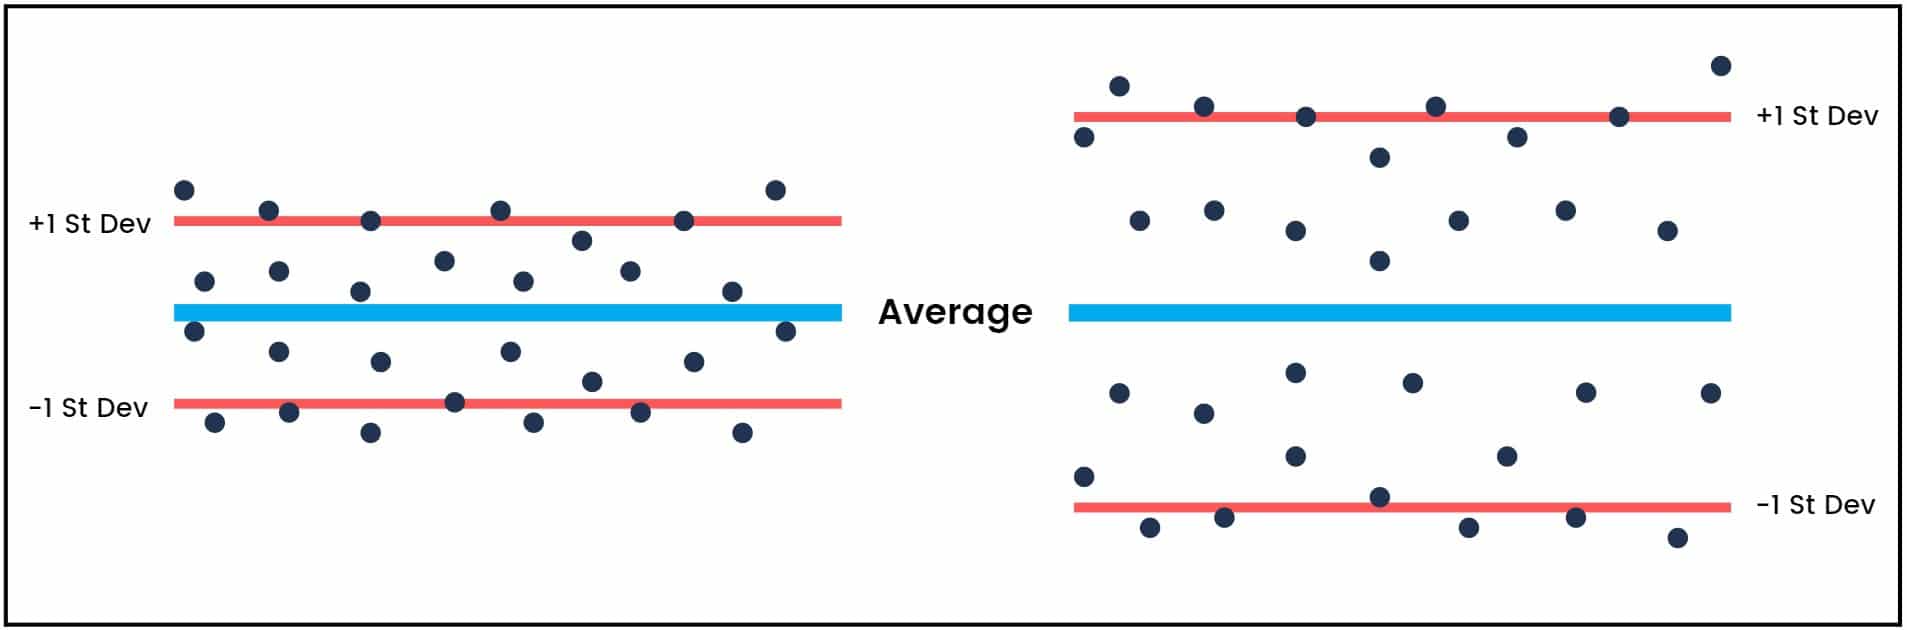
Deviation bands succeed where dollar or percent measurement cannot, standardizing volatility across stocks of all sizes.
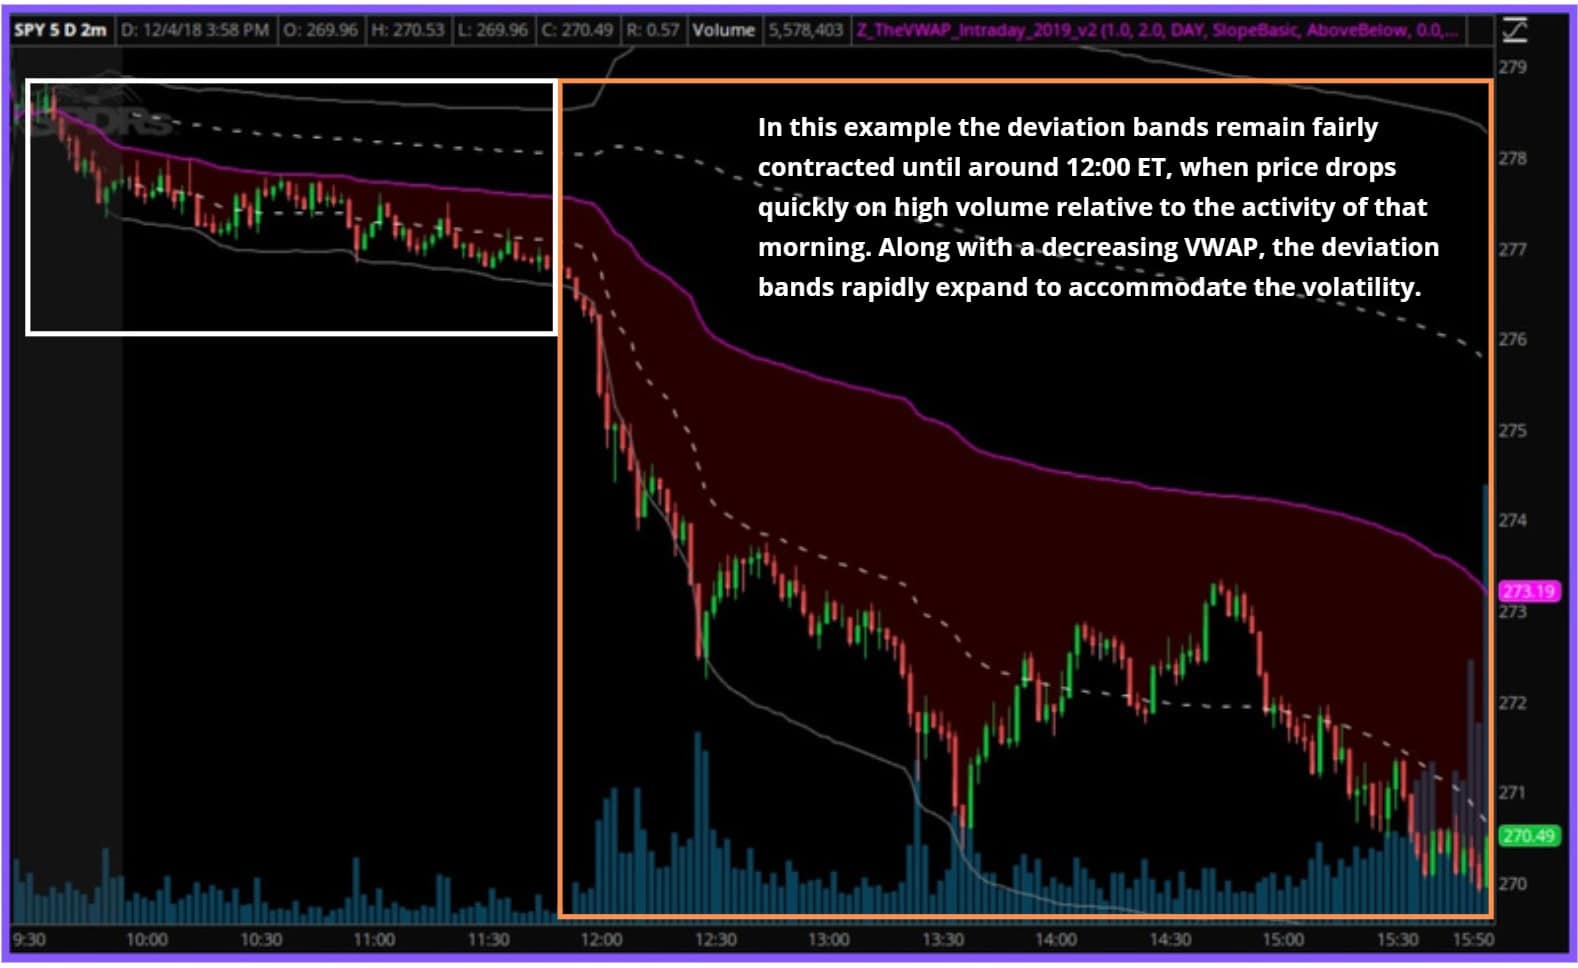
Deviation bands are plotted continuously alongside VWAP, automatically adjusting as we receive more data. They typically start off small and expand as price begins to break away from the market’s average but lacking any notable volume or volatility they remain stable throughout the day.
The rate at which they change will vary depending on both how far away from VWAP we venture and how much volume is being transacted when we do.
Trading With VWAP
Applying VWAP and deviation bands to a chart creates a virtual grid system that allows you to categorize market activity into meaningful themes. Like lane markers on a road, the deviation bands thematically group the market into zones. Each region has unique characteristics and different expectations (directional long/short versus no identifiable trend). This allows for a superior reframing of how we analyze a chart, shifting from “is this a long or a short?” to “is this even moving?”.
Though simple and understandable, viewing every chart as a long or a short is a misguided binary choice. Rather than bull against bear, it’s chop against trend (or random vs. non-random). During periods of consolidation, there’s no discernible edge to help you make money. Accordingly, distinguishing between directional or non-directional markets should be your primary objective.
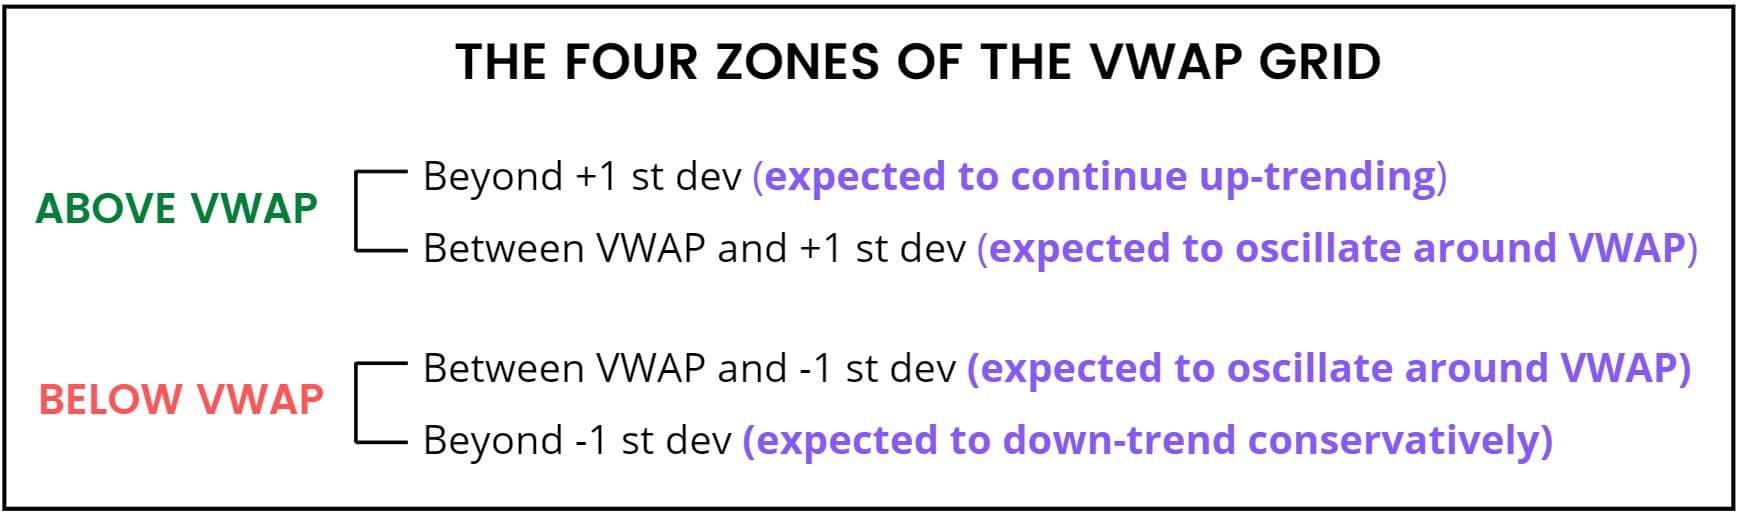
Price crossing between VWAP zones is a noteworthy event, and more often than not it’s met with a certain degree of resistance. The barriers separating the zones (VWAP and deviation bands) are otherwise hidden areas of support and resistance that can be utilized for trade entries and risk levels, as well as for ongoing trade management once a position has been initiated.
These barriers are auto-calculating and dynamic, fluctuating throughout the day as we receive new price and volume data. The zones expand when price sustains a trend, and contract when price consolidates towards VWAP. Price crossing into another zone typically signifies a change in trend, but the slope of VWAP (the rate at which it is changing) can foreshadow an upcoming shift even farther in advance.
PEOPLE WHO READ THIS ALSO VIEWED:


