This approach analyses candlestick patterns to filter out some of the “noise” in the market. In Japanese, the meaning of “Heiken” is average, and “Ashi” refers to bar, and unsurprisingly this approach involves establishing the average bar. Once that has been done, it’s possible to decide whether momentum is building, continuing, or reversing. All the information needed is included on simple price charts. It’s just a case of reflecting on what the data contained in the charts reveals.
In this article, we’ll use real-life trade examples to look at:
- Heiken Ashi Strategies Explained
- Standard and Heiken Ashi Candlesticks Compared
- How to Use Heiken Ashi to Identify a Trend
- Advantages of Using Heiken Ashi Trading Strategies
- Disadvantages of Using Heiken Ashi Trading Strategies
- Case Study – Using Heiken Ashi to Trade Trends
- Strategies That Work Well With Heiken Ashi Indicators
- The Bottom Line
Heiken Ashi Strategies Explained
Standard candlestick charts display the opening, high, low, and closing price in purely numerical terms.
In the below price chart of the Russell 2000 stock index, the hourly candle A’s opening, high, low, and closing prices are 2235.8, 2238.4, 2220.3, and 2224.7.
Standard Candlesticks – Russell 2000 index Hourly Candles
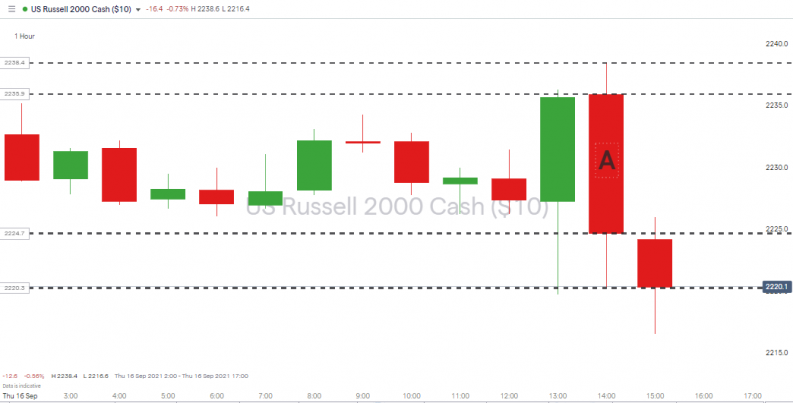
Source: IG
Setting that same price chart to report prices using Heiken Ashi methodology results in a new set of opening, high, low, and closing prices = 2229.4, 2238.4, 2220.3 and 2229.8. Also, note the colour change from red to green, meaning that on a Heiken Ashi chart, the same time interval is reported as an upward price move.
Heiken Ashi Candlesticks – Russell 2000 index Hourly Candles
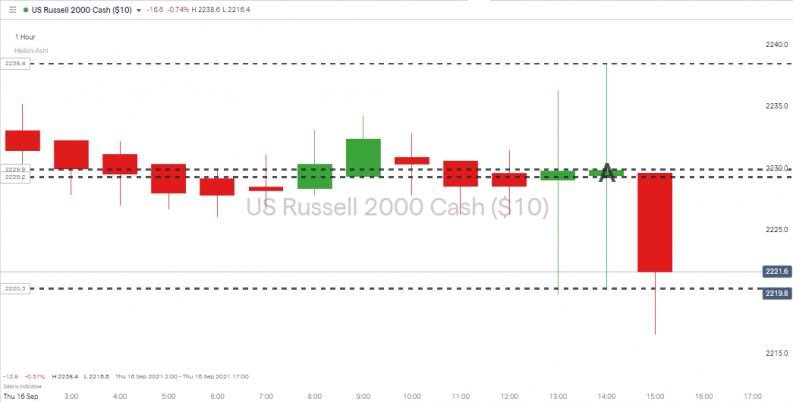
Source: IG
The different dimensions of the candle are due to Heiken Ashi candles using the same raw price data but applying a particular formula.
- Open = (Open of Previous Candle + Close of Previous Candle) / 2 = The midpoint of the previous bar
- Close = (Open + High + Low + Close) / 4 = The average price of the current bar
- High = Maximum Price Reached
- Low = Minimum Price Reached
Notes:
- The numbers in a classic candlestick chart are presented as Open, High, Low, Close (OHLC), but in a Heiken Ashi, they are presented as Close, Open, High, Low (COHL).
- All candles open from the middle of the previous one. The closing price of each candle is the average value of the OHLC prices combined.
Standard and Heiken Ashi Candlesticks Compared
Monitoring a single market over the same period makes it possible to flick between standard and Heiken Ashi mode settings. The Nasdaq 100 index set to 1hr candles looks like this:
Standard Candlesticks
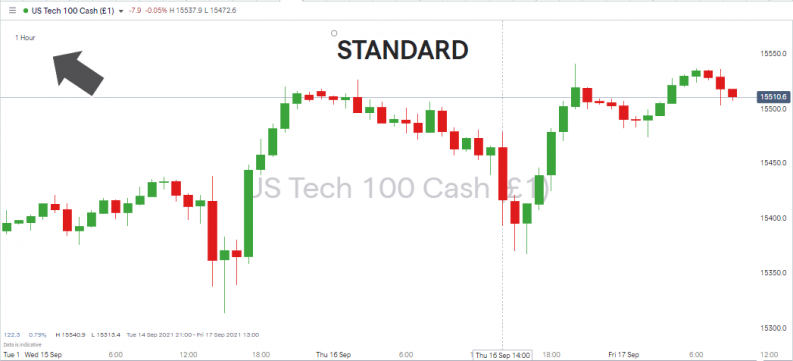
Source: IG
Heiken Ashi Candlesticks
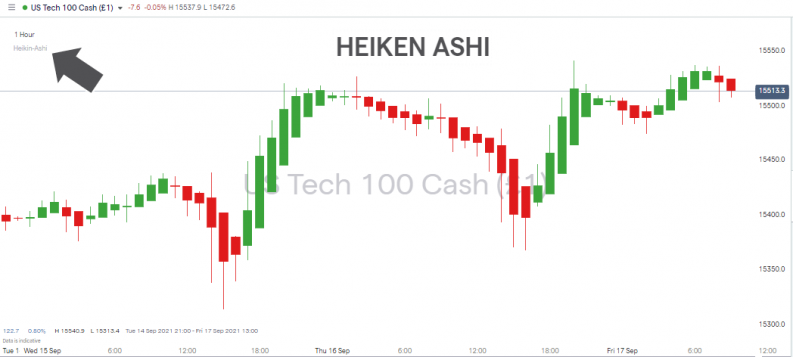
Source: IG
How to Use Heiken Ashi to Identify a Trend
The two charts have obvious similarities, they are, after all, based on the same raw data, but the Heiken Ashi candles have applied a formula that creates subtle differences. As a result, the shape of the Heiken Ashi candles offers different insights into market momentum.
- Bullish Heiken Ashi candlesticks have no downside wick or very small wicks. This indicates a strong uptrend and excellent buying opportunities.
- Candlesticks with a small body and long upper and lower wicks signal a potential reversal.
- Bearish Heiken Ashi candlesticks have no upside wick or very small wicks. This indicates a strong downtrend and excellent selling opportunities.
- Small Heiken Ashi candlesticks of the same colour denote the trend is stable.
- Colour change is important. If the candle sequence flips from one colour to another, there is a strong chance of a trend reversal.
Advantages of Using Heiken Ashi Trading Strategies
- The popularity of the strategy means good brokers supply the software tools as standard. It’s just a case of selecting the chart type.
- With so many using the strategy, there is a strong chance of trading with the herd rather than against.
- The formula behind the candlesticks makes trend direction and reversal easier to spot, and as there are fewer of them, they tend to be more reliable.
- In the same way, strategies using Heiken Ashi methodology are also less prone to displaying false breakouts.
- Heiken Ashi bullish and bearish candles alternate less frequently than standard candlestick charts. This means signals are clearer.
- Riding trends is a great way to maximise your profits.
- Data shows retail traders have a blind spot in terms of trends and often trade against them. Systems such as Heiken Ashi help counter that and instil trading discipline.
- Fits in well with other strategies.
- It’s possible to set up automated strategies which use Heiken Ashi signals.
Heiken Ashi Candlesticks – Gold Price Chart Daily Candles
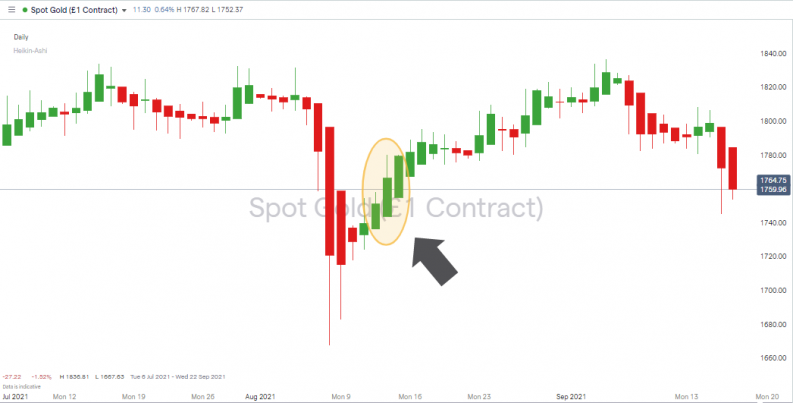
Source: IG
Disadvantages of Using Heiken Ashi Trading Strategies
- It can take time to develop the skills to spot trend patterns. Due to the smoothing effect of averaging out the price data, they don’t develop as frequently as with standard candlestick charts.
- In general, technical indicators are limited because they are lagging indicators based on previous price activity. Heiken Ashi is not immune from the common problems which explain why technical indicators fail.
- Paradigm shift – trading solely using technical indicators introduces the risk of price changing due to fundamental It is essential to also keep up to date with market news events.
- All periods of market momentum eventually come to an end. This approach can’t resolve that simple market fact, and trade management is essential to ensure exit points are optimised.
Case Study – Using Heiken Ashi to Trade Trends in Forex
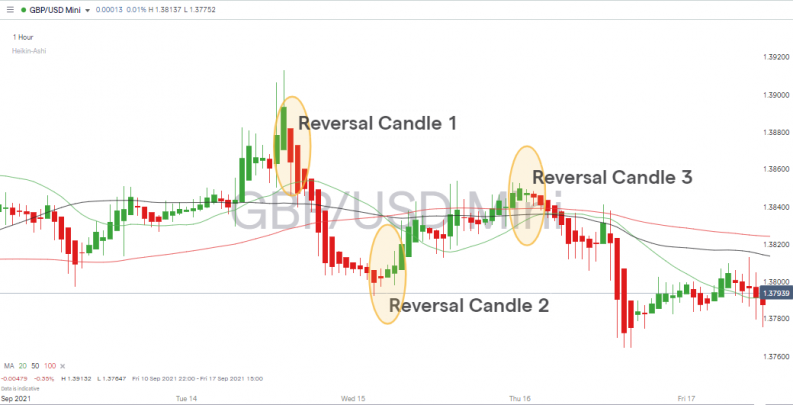
The below example from the forex markets illustrates the effectiveness of Heiken Ashi candles in spotting a trend reversal. These changes in momentum, of course, also mark the start of a new trend and can be easily identified in the GBPUSD’ Cable’ market on an hourly time frame.
Reversal candle one has a lower close than the previous candle and changes colour from green to red. This indication of momentum moving from upwards to downwards proves reliable, and the size of this candle and the next one suggests the move has strong support. The following candles in the sequence are of varying size, but all are the same colour, red, indicating now is the time to sell short.
Heiken Ashi Candles – Case Study Trading GBPUSD – Hourly Candles – Trend Reversals
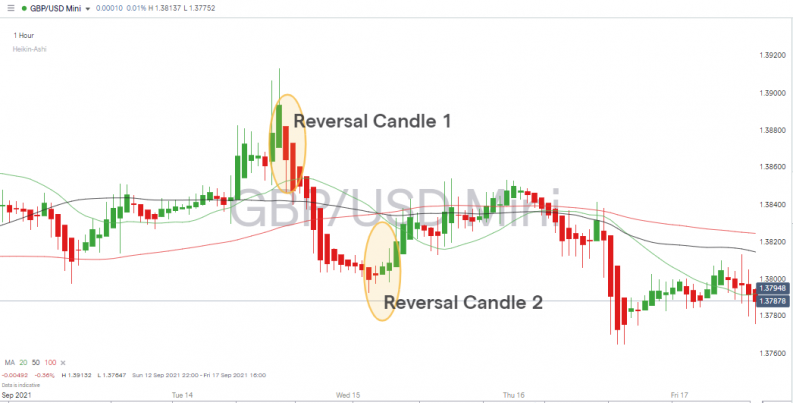
Source: IG
Extra momentum is needed and found to break through the 1hr 20, 50 and 100 Simple Moving Averages, but smaller candles then follow, and the trend can be seen to be slowing down. That is a sign that short positions put on near Reversal Candle 1 might need to be exited.
The doji candle, with a small body and relatively long wicks to the upside and downside, is a classic Heiken Ashi sign that a trend is reversing. Being quickly followed by a green candle confirms that the time has come to close out short positions and look to go long.
Heiken Ashi Candles – Case Study Trading GBPUSD – Hourly Candles – Dojis
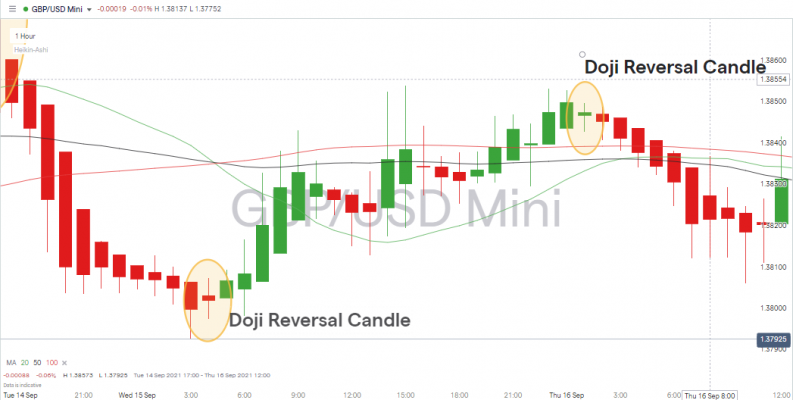
Source: IG
The upward move after Reversal Candle 2 is at first marked by smaller candles which suggests that the amount of buying interest is not as strong as the selling interest that followed Reversal Candle 1.
Heiken Ashi Candles – Case Study Trading GBPUSD – Hourly Candles – Trend Reversals
Source: IG
This indicates that the trend may not be as long-lasting, and sure enough, there is soon a period of sideways trading denoted by a mixture of red and green candles. The green doji candle at Reversal Candle 3 is the clue that it might be time to exit long positions and look to go short again. The downward trend which follows is marked by a long sequence of red candles and a chance to profit from positions that are short GBPUSD.
Stop Losses and Take Profits on Heiken Ashi Trading Strategies
In the above example, effective risk management would have been able to have been applied without hampering returns. Below are some standard parameters that would have worked in the GBPUSD case study that are worth practising using a Demo account.
Upwards Trending Markets:
- Set your protective Stop Loss below the first bullish candle low.
- Take profit after a close below a previous bullish candle.
Downwards Trending Markets:
- Set your protective Stop Loss above the first bearish candle high.
- Take profit after a close above a bearish candle.
Strategies That Work Well With Heiken Ashi Indicators
Heiken Ashi candles are great at providing a clearer understanding of market momentum and cutting down on the number of false signals. Still, all indicators benefit from being used in conjunction with others. Whether your trading style is based on day trading, swing trading or trend following, incorporating signals from the below is always a good idea.
The Bottom Line
Heiken Ashi candles make charts more readable and trends easier to analyse. Developing trend spotting skills is a key ingredient to successful trading, and this strategy helps traders go with the flow rather than against. It can’t be guaranteed that future price moves will carry on in the same direction, but this approach tilts the scales in the right direction.
The methodology is simply a different way of displaying price data on charts, and the result is a chance to get an in-depth view of the market. You can use it when making trades that require precise entries and exits, and the tools to apply the methods are freely available at good broking platforms.
Further Reading
- Read here to learn about the nature of trends and Elliot Wave Theory.
- This article considers strategies that trade using swing lows.
- Head here to find out about other indicators used to spot trends.
- Are you still researching? These case studies consider ways to trade the commodity markets using trend analysis.


