Key points:
- The VIX index is also known as Wall Street’s fear and greed index.
- The index has been trading at or near its recent highs for a few weeks.
- Read on to discover how it predicts a trading range for US stocks.
The Volatility Index, also known as the VIX, is regarded as Wall Street’s greed and fear index, with high readings indicating maximum fear and low readings indicating maximum greed.
Investors tend to be least fearful when the stock markets are doing great and printing new highs, leading to a low VIX reading, compared to the extreme fear they usually feel when the market is falling, printing new lows and eroding the value of their investments.
Also read: What Are The Best Performing ETFs in 2022.
Therefore, savvy investors use the VIX as a contrary indicator such that they tend to buy stocks when the index is near its all-time highs and then sell stocks when the VIX is near its all-time lows showing that investors are not worried about potential declines.
 WELCOME BONUS - Free Share Bundle When You Invest £50!
Get up to £500 cashback for investing with IG.
WELCOME BONUS - Free Share Bundle When You Invest £50!
Get up to £500 cashback for investing with IG.
Recently, the VIX has been alternating between highs of 34.7 to 38 and lows of 15 to 18.60. Therefore, whenever the VIX trades near 34, we can say that it is at or near its highs; whenever the index is at or near 18.6 to 15, it is clearly at its lows.
The VIX index was trading above 33 from late April to early May when we predicted we could get a stock market rally. Instead, we got a stock market bounce lasting 2-3 days in late April and mid-May before the current downtrend continued, leaving the VIX trading near its highs.
Today, the VIX is trading at 30.15, which is very near its recent highs, yet stocks are still falling, making a case for another bounce. However, the VIX is not at its recent highs above 35 and 36, which indicates that we are likely to get a slight bounce rather than a sharp rally.
At this point, the likely scenario is that stocks will be stuck in a trading range over the next few months as bulls fight to defend the crucial 3900 support level on the S&P 500 and the bears fight to defend the 4100 resistance level.
A trading range now makes more sense because the VIX has been trading above 33 for over two weeks, from late April to mid-May, yet we haven’t got the much-anticipated rally. So it is more likely that such a rally may not be on the cards.
However, the stock market is likely to keep whipsawing for the next few months, and traders should look to capitalise on these swings to capture short-term trade opportunities.
*This is not investment advice. Always do your due diligence before making investment decisions.
The VIX daily price chart.
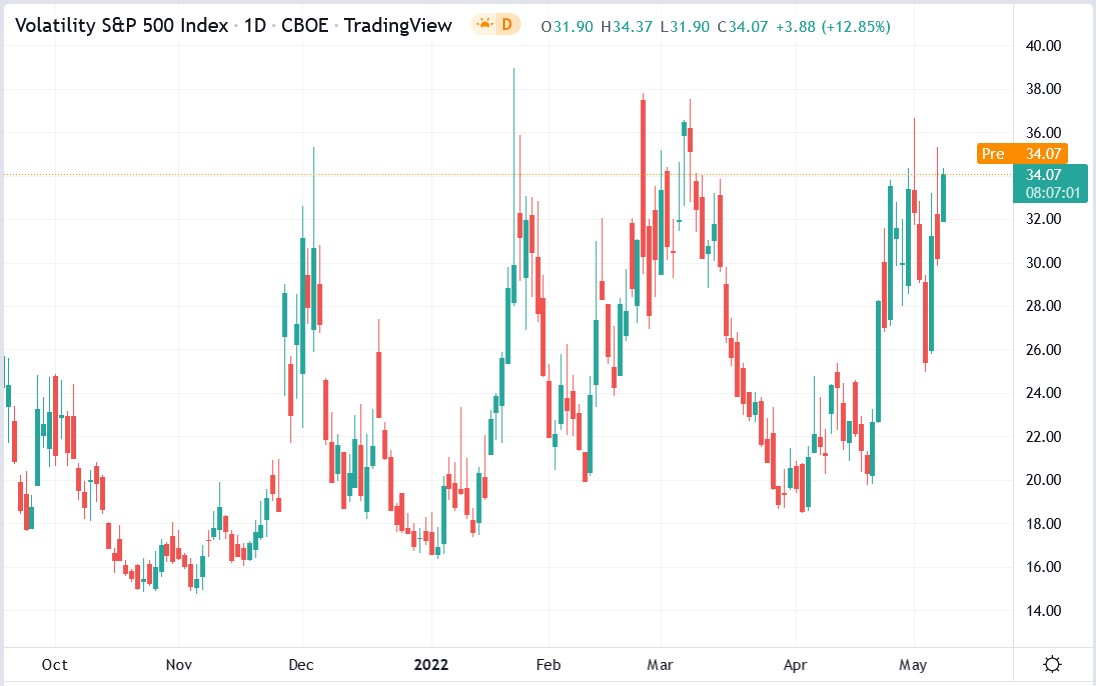
The VIX daily price chart shows its lows, highs and current price.