Rule number one of successful trading and investing is to trade with the trend. If done correctly it can bring the biggest rewards regardless of whether your investment time frame is hours, days, or years. For new traders, in particular, momentum trading is one of the most popular strategies to adopt because trades with strong momentum are much easier to manage and tend to have clear entry and exit points, along with a strong probability of success.
YOUR CAPITAL IS AT RISK
Momentum trading is at face value a straightforward proposition. Understanding certain aspects of the strategy can help optimise returns. One common mistake for beginner traders is to trade the reversal in the belief that the price “has got to turn soon”. There can also be a temptation to think just “chucking a trade on” is too easy. In fact, historical data points to anyone who bought just about any basket of stocks in 2009 would have made an eye-watering return.
 WELCOME BONUS - Free Share Bundle When You Invest £50!
Get up to £500 cashback for investing with IG.
WELCOME BONUS - Free Share Bundle When You Invest £50!
Get up to £500 cashback for investing with IG.
What Is Momentum Trading
The basic idea behind momentum trading is that a stock that has started to trend upwards is more likely to continue to rise in price than to fall. The principle is that once price starts going up, more and more traders and speculators will be interested in buying. That buying pressure means prices will continue to go up as demand outstrips supply. Once we have an entry in an upwards trending stock, we’ll either hold until it hits our predefined exit point, or we’ll sell once the momentum ends and the price starts to consolidate, trade sideways, or fall.
Momentum trading is a form of technical analysis. It uses historical data relating to price moves to predict the future direction of a market. Other metrics are also applied to help spot momentum. These include trade volumes – the greater the amount of trading, the greater the chance a trend is forming. Trendline strategies are tools that are also used, as are RSI, pullback strategies, and Heiken Ashi candlesticks.
S&P 500 Index – September 2004 – April 2022
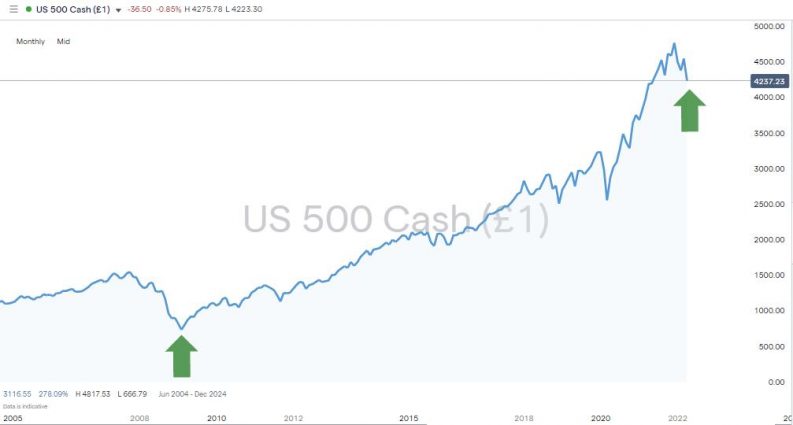
Source: IG
Of course, nothing lasts forever, and the saying goes that “the trend is your friend, until the bend at the end”. In this guide, we’ll provide a brief recap of what momentum trading is and how to get the most benefit from it. Then we’ll give you our recommended top 5 best momentum stocks to buy, along with predefined entry and exit points.
Top 5 Momentum Stocks
Momentum Stock 1 – Petroleo BR
Petroleo Brasileiro is involved with the exploration, development, and production of oil and gas. The stock price suffered a huge drop in 2020 due to Covid lockdowns reducing global demand for oil. Petroleo has since established a strong uptrend, and price action is now buoyed by a supporting trendline that, in line with the classic interpretation of trendline strategy, has been confirmed by there being at least three instances of price bouncing off the support level.
Petroleo Brasileiro ADR – Daily Price Chart April 2020 – April 2022 – Trendline Support
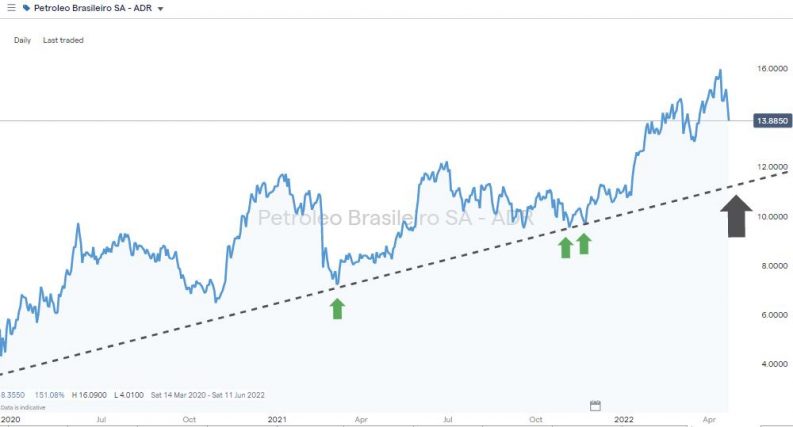
Source: IG
Petroleo Brasileiro ADR – Daily Price Chart April 2020 – April 2022 – SMAs & Entry Point
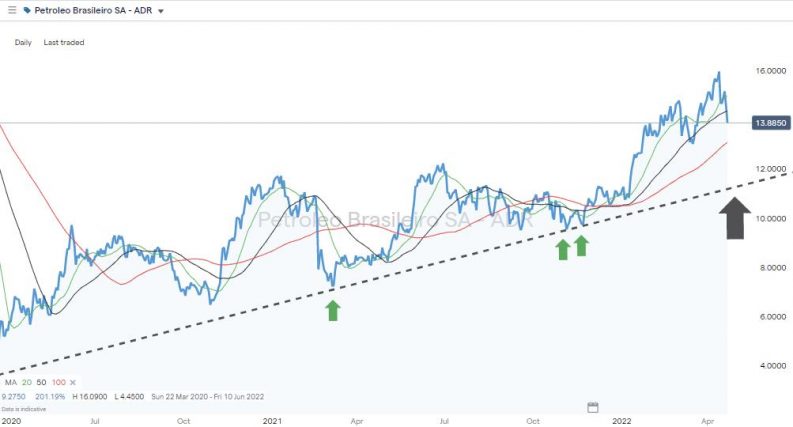
Source: IG
- Price is trending in a channel since April 2020
- 20 / 50 / 10-day SMAs (Simple Moving Averages) are aligned above each other
- Price is above recent range levels
- Entry level in the region of the supporting trendline – currently $11.20
- First target is price high of March 2019 at $17.11
- Second target is previous resistance at $19.31
Petroleo Brasileiro ADR – Daily Price Chart April 2020 – April 2022 – Resistance and Exit Point
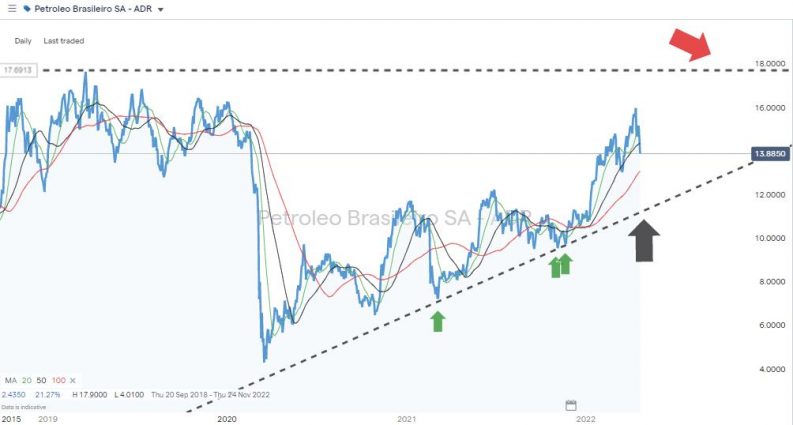
Source: IG
Momentum Stock 2 – Sony Group Corporation ADR
Our second momentum stock pick is Sony Group Corporation, one of the world’s leading producers of electronic products. Shortages of chips have resulted in slow sales of some products, and the legacy of Covid lockdowns still hangs over the Sony Pictures division. This had led to a break of the supporting trendline, but with the price sitting on the 50% Fibonacci retracement support level, there is good reason to see the recent price moves as a short-term correction.
Sony Group Corporation – Daily Price Chart – July 2018 – April 2022 – Trendline break / Correction
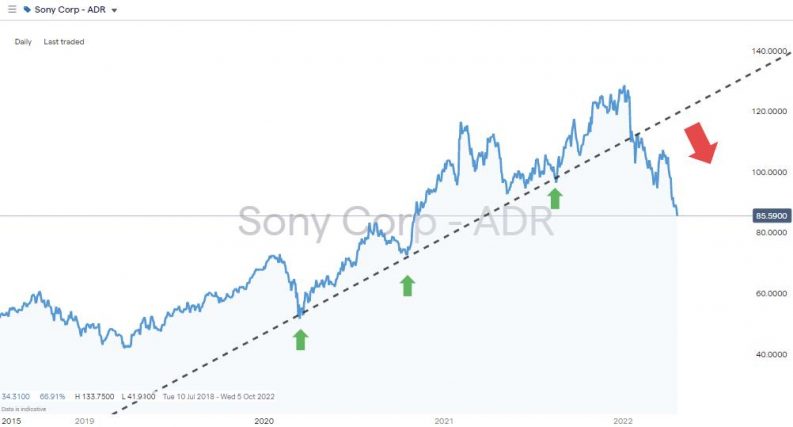
Source: IG
The Sony brand still ranks as one of the most identifiable globally, and the firm has announced its PlayStation VR2 virtual headset. Upside opportunities also include EVs with the firm recently breaking out its electric vehicle operations into a stand-alone unit.
Sony Group Corporation – Daily Price Chart – July 2018 – April 2022 – Fibonacci Retracement
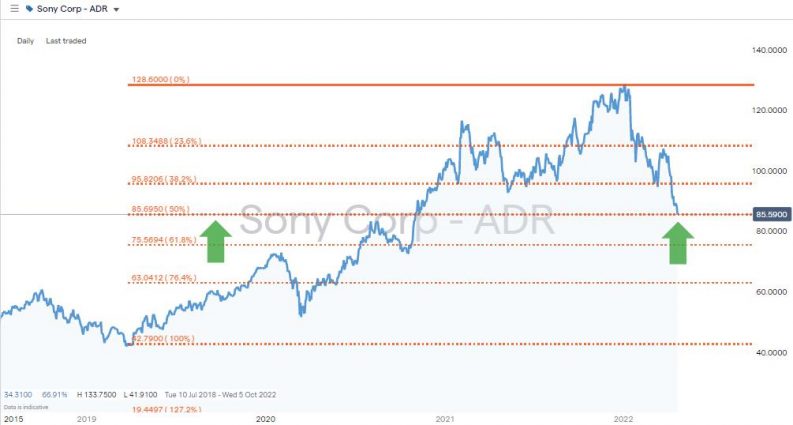
Source: IG
- The Q1 2022 weakness in Sony stock was part of a tech-sector-wide correction rather than being stock specific
- The Fibonacci 50% price support sits at $85.69
- Price target is price high of $133.75 printed in January 2022
- Not all trades are winners, but this strategy allows for a relatively tight stop-loss to be set in the region of $75.56, which is the area of the 61.8% Fibonacci retracement and the swing-low support level of October 2020
Momentum Stock 3 – Walt Disney Co
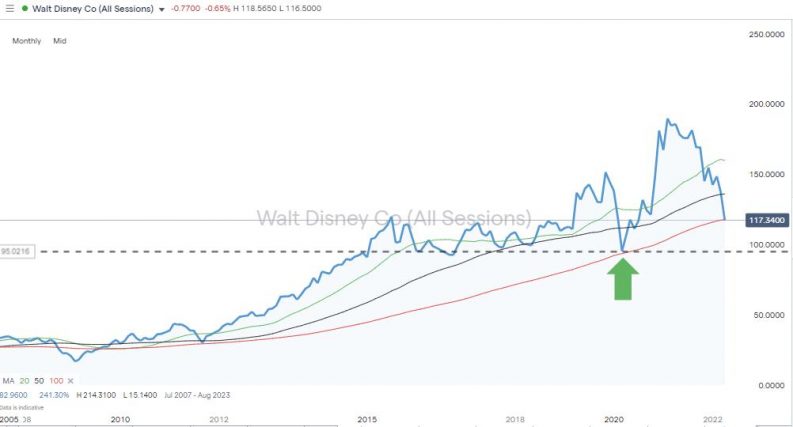
Our third momentum trade is the Walt Disney Company. Having seen its theme park businesses suffer due to the pandemic and having sales for its entertainment products being below target has meant price has been suppressed in recent months. Disney is expected to benefit from pent up demand as the global economy builds up steam after the easing of lockdown restrictions and the recent pullback can be seen as a buying opportunity as other metrics used to measure momentum are still intact.
Walt Disney Co – Monthly Price Chart – 2008 – April 2022 – Higher Highs & Higher Lows
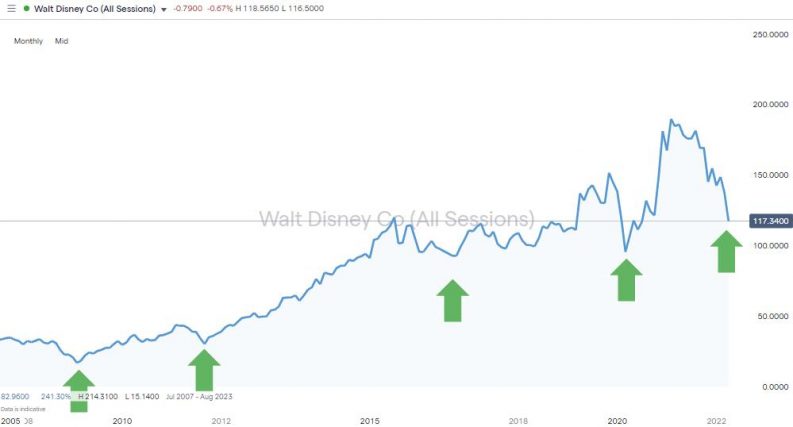
Source: IG
One of the most straightforward ways to identify a market showing upwards momentum is to look for price charts showing higher highs and higher lows. While the price of Disney stock holds above $78.54, which marks the swing-low of March 2020, the momentum pattern dating back to February 2009 remains in a bullish pattern.
Walt Disney Co – Monthly Price Chart – 2008 – April 2022 – SMAs & Key price support
Source: IG
- The Q1 2022 weakness in Sony stock was part of a tech-sector-wide correction rather than being stock specific
- Entry point 1: $117 – $120. Price is currently in the region of the 100 SMA on the Monthly Price Chart, which has previously been a reliable indicator of the lowest level at which Sony will trade
- Target price is $214, which is the level of the price high recorded in February 2021
- This strategy allows for a relatively tight stop-loss to be used. If the March 2020 swing-low of $78.54 is broken, then a multi-year bullish price pattern will be broken. Setting stop-losses just below this level offers the opportunity for considerable upside – if the upward momentum pattern holds, but caps losses if this is indeed a long-term reversal in the fortunes of Disney stock.
Momentum Stock 4 – Verizon Communications Inc
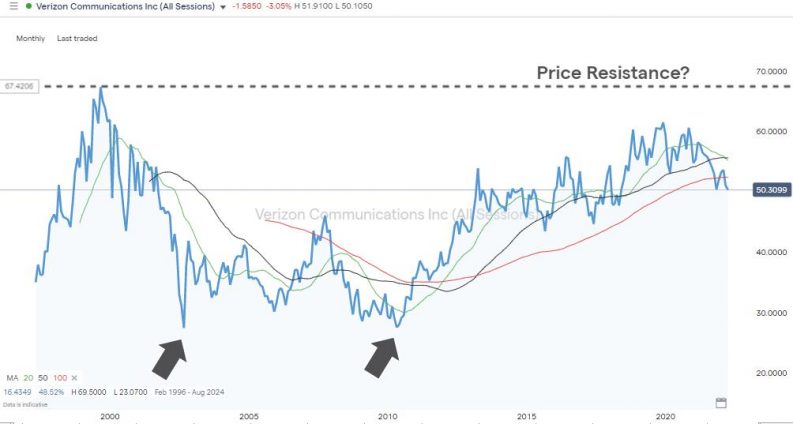
America’s largest telecoms carrier Verizon is our fourth momentum stock pick. The stock looks undervalued in historic terms and is expected to benefit from the rollout of 5G. The stock is popular with dividend investors, and we don’t expect it to trade at the current discounted price for long. We’re looking for entries around $45 – $52 and expecting a move to above $60 to match the high of January 2020 and above $67 in extension.
Verizon Comms Inc – Monthly Price Chart – 2002 – April 2022 – All-time Price High?
Source: IG
Part of the appeal of buying Verizon is the stock formed a multi-year double-bottom pattern, which is a much-appreciated sign that the stock has a secure price base level. Working off this foundation, it’s possible to see the Verizon stock price pushing on upwards thanks to its position as the most reliable 5G provider in the US.
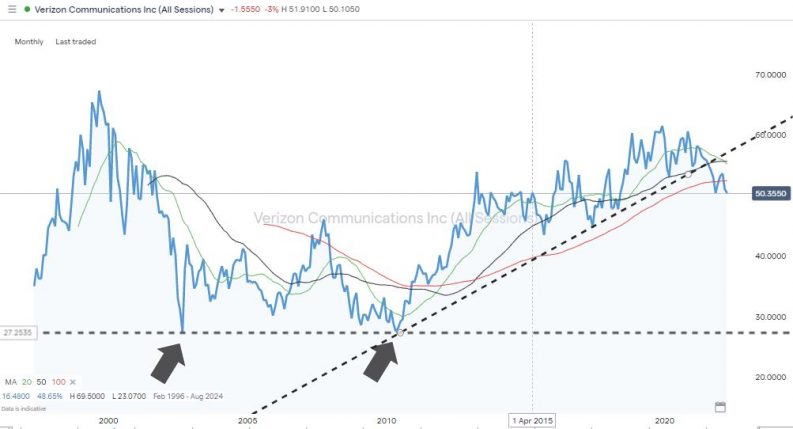
Verizon Comms Inc – Monthly Price Chart – 2002 – April 2022 – All-time Price High?
Source: IG
- The price has been trending upwards in a bullish channel for several years
- Current price is sitting just below the supporting trendline, but this could be only a short-term break out of the upwards price channel
- Entry price zone: $45 – $52
- Risk reward ratio is high at this level as we expect a move towards the all-time-high price of $67
- Stop-loss orders can be set below the price level of $44.7, which marks the level of the last significant swing-low recorded in June 2017
Momentum stock 5 – Papa John’s Intl Inc
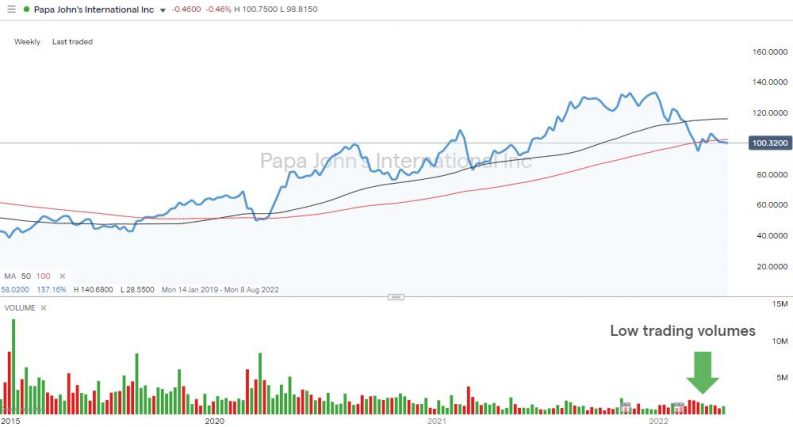
One of America’s largest pizza restaurants, Papa John’s is our final momentum stock pick. The price has been trending upwards for several years, and price is currently trading in the region of the 100 SMA on the Daily Price Chart. That SMA has in the past proved to be a reliable indicator of when it is time to buy the dips.
The fall in the price of Papa John’s stock in Q1 of 2022 was not associated with a corresponding spike in trade volumes. This suggests it was the result of the stock being overbought in the short term rather than a paradigm shift in the prospects of the firm.
Papa John’s – Weekly Price Chart – 2019 – April 2022 – Trading Volumes
Source: IG
If any surge in the share price was associated with an uptick in trade volumes, that would be a confirmatory signal that momentum is pointing towards future upward price moves. Even if trading volumes remain static, the ‘higher highs and higher lows’ pattern over recent years is enough of a sign that Papa John’s could soon be testing its all-time high share price of $138.52.
- Uptrend established since July 2019
- Price sitting below the supporting trendline but not fully broken away from it
- Recent sell-off was associated with relatively low trading volumes
- A smaller channel has opened up on the 4H chart, and price is also at the lower end of that channel
- We’re looking for buys around the $100 price level as this is in the region of the 100 SMA on the Weekly Price Chart and a psychologically important price level
- Price target +$130
Final Thoughts
Momentum trading strategies are one of the easiest to follow, but there are ways to optimise returns. Looking for a combination of signals is one way to improve your win-loss ratio. Another is to test new strategies in a demo account prior to applying real cash.
There is also the question of how to spot a ‘paradigm shift’ the moment when a trend turns and reverses. To help with that, it can be useful to remember the old trading floor adage to “join the party late and leave it early”. That helps traders to not beat themselves up if they don’t pick the very bottom and top of a trend, as making money is not necessarily about trading perfectly.
Good online brokers will offer the tools required to measure market momentum and come equipped with impressive charting packages to support research and analysis. Browse this list of trusted brokers to find firms that are regulated by Tier-1 financial authorities and also have a track record of helping traders make the best possible start when trading the markets.