Pullback trading strategies are based on the idea that following the herd is a good thing. It quite often is, but this article will establish ways that returns can be optimised and what other factors traders need to look out for. In this article, we’ll use real-life trade examples to look through:
- Pullback Strategies Explained
- How to Identify a Trend
- How to Trade a Pullback Strategy
- Best Pullback Trading Strategy Indicators
- Case Study – Using Pullback Signals With Other Indicators
- Advantages of Trading Pullback Strategies
- Disadvantages of Trading Pullback Strategies
- The Bottom Line
Pullback Strategies Explained
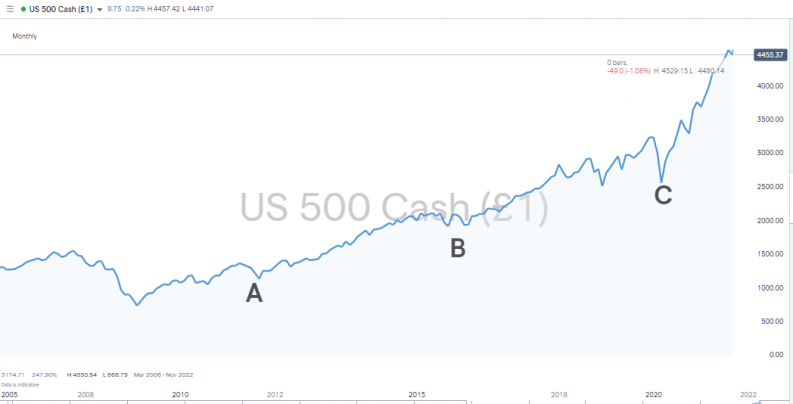
Market pullbacks are probably best explained through the use of a chart. The below 15-year chart for the S&P 500 outlines how price in the world’s flagship equity index has thrown up a whole number of trading opportunities. The index includes the world’s largest 500 firms by market capitalisation, and points A, B and C on the chart denote short-term pullbacks that created trading opportunities.
S&P 500 Price Chart – Monthly Chart of Upward Trend Momentum With Higher Highs and Higher Lows
Source: IG
Pullback trading works on the basis that price doesn’t move in a straight line, and while the long-term trend is for prices to rise, the moments when uncertainty grips, the markets offer opportunities to buy into a market at a lower level.
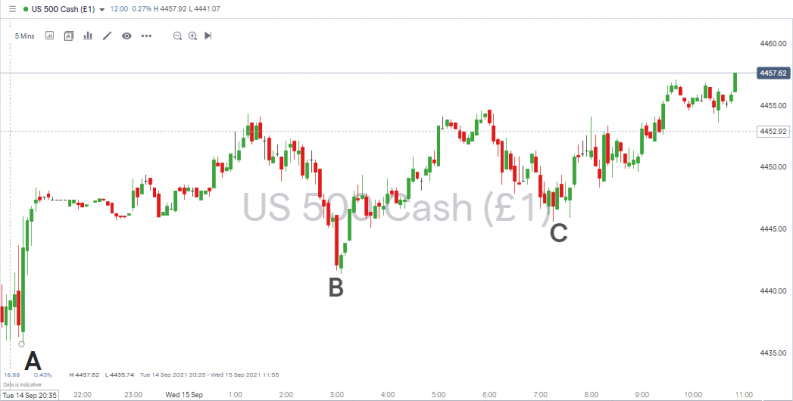
Pullback strategies can work over any time-frame and in any market. The below intraday candlestick chart shows the same instrument, the S&P 500 index, with timeframes set to five-minute intervals. The principles are the same, with pullback buying opportunities once more identified.
S&P 500 Price Chart – 5-Min Chart of Upward Trend Momentum With Higher Highs and Higher Lows
Source: IG
Pullback Strategies in Downward Trending Market
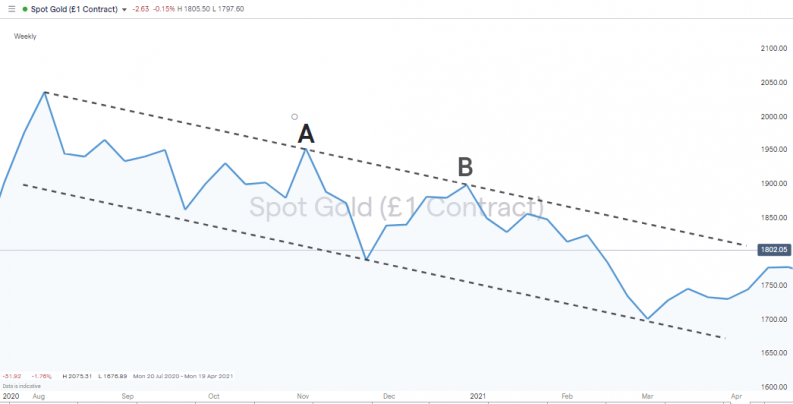
Pullback trading has long been associated with bullish equity markets. The multi-year upward trend in the ever-popular stock markets has encouraged a lot of equity investors to focus on efforts to ‘buy the dips’. While pullbacks have become associated with upward trends, the principles can be applied to markets with downward momentum.
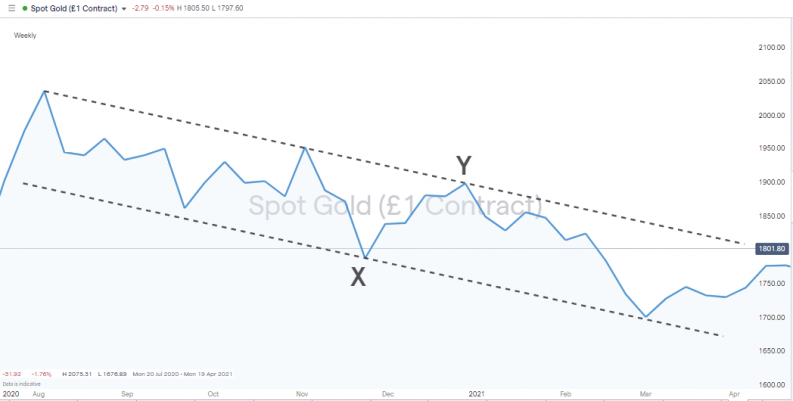
In the below example, the price of gold fell from $2,034 in August 2020 to $1,697 in March 2021. The tramlines highlight a textbook-quality downward trend, with the pullbacks marked A and B being opportunities to sell, or sell short, the asset.
Gold Price Chart – Weekly Chart of Downward Trend Momentum With Lower Highs and Lower Lows
Source: IG
What Is the Difference Between a Pullback and a Retracement?
One term that it pays to get to grips with is ‘retracement’ – a term used interchangeably with pullback. In the below example, a trader who is active in the gold market during the same period as above buys at X and sells at Y and is trading the retracement. This strategy relies on there being periods of time when market price goes in the opposite direction to the long-term trend. Some strategies specialise in trading retracement opportunities, but there are additional risks involved with those because they are taking positions against overall market momentum – so if they do go wrong, losses can be magnified.
Gold Price Chart – Weekly Chart of Downward Trend Momentum With Lower Highs and Lower Lows
Source: IG
While the terms are used interchangeably, a pullback is typically viewed as being shorter-lived than a retracement.
What Is the Difference Between a Pullback and a Correction and a Reversal?
A market ‘correction’ is when price reverses by more than 10% from its 52-week high. These can take some time to happen, and in the case of major stock indices are relatively rare.
Reversal is another term that is used in the same context. This term is usually applied to a fundamental shift in market dynamics. It might be that a firm has announced news to the market, which means that many think that it is now overvalued. A pullback, in contrast, is more likely to be used to describe a moment when buying pressure subsides for a short time, but where the underlying situation is unchanged.
How to Identify a Trend
Making the decision to trade with market momentum rather than against it is step one, but raises the question of how to spot trends. The trends illustrated in the charts so far are easy enough to understand, but don’t forget that at point A and B in the charts, the future price move was at that time unknown.
Using Price Action to Identify Trends
One of the fundamental factors to consider is ‘higher highs and higher lows’, which is an adage used to spot upward-trending markets. For downward-trending ones, the things to look out for would be ‘lower lows and lower highs’.
EURUSD Price Chart – Daily Chart With Swing Lows
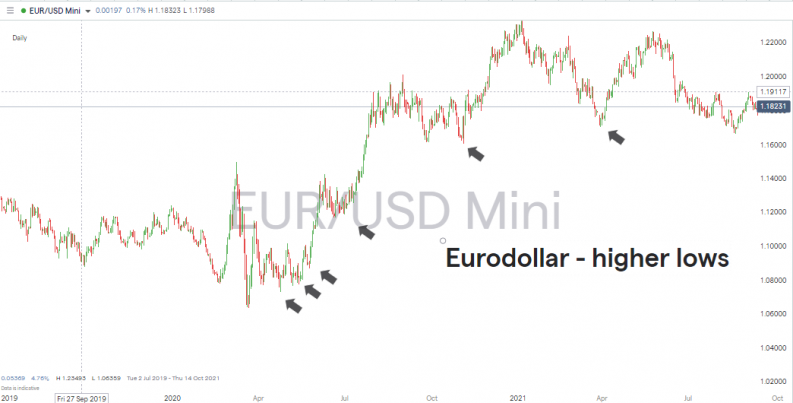
Source: IG
Using Charting Tools to Identify Trends
Another tool to use is trend-line chart graphics. The downward channel in the gold market trade example is the kind of thing to look out for. It should be noted that the lines won’t always be as parallel as they are in this case.
The example below shows that Bitcoin’s price surge in the second half of 2020 could have two separate trend lines applied to it. T1 and T2 both have a valid case for being considered, with the general rule being that the more times price touches a trend line, the stronger that line is as an indicator.
Bitcoin Price Chart – Daily Chart With Trend Line Analysis
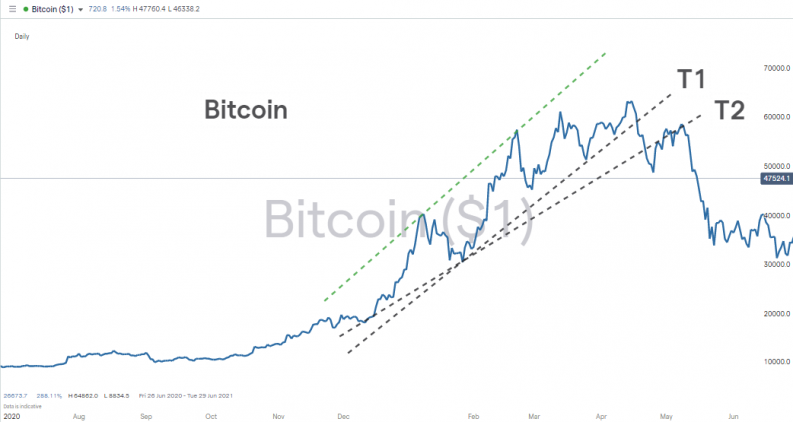
Source: IG
T2 starts from an earlier date, but T1 more closely reflects price action, and those who used T1 as their trading signal would have made a large profit on any long position, assuming that they sold when price broke the support line, signalling that the trend was over. Those using T2 as a guide would have sold out at a later date and a lower price as denoted by the arrow.
Bitcoin Price Chart – Daily Chart With Trend Line Analysis
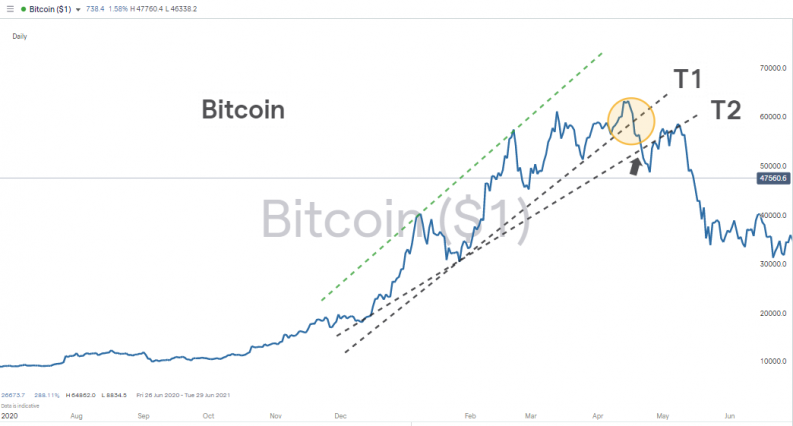
Source: IG
How to Identify a Pullback
Trading pullbacks requires a degree of patience. The price movement is one big giveaway that a pullback is occurring – price falling away from a price peak being the obvious signal. There are other metrics to consider and, as importantly, at what time to step into the market to trade. At the time that price starts to change direction, there is every chance that the move could be more than short-lived.
- If trading volumes increase at the time of the trade reversal, the move might be more fundamental in nature. If volumes are consistent, then there is more chance that the price move is short term in nature.
- Any price move accompanied by, or triggered by, market events or company news could signal a change in the perception of valuations and that the price move will be greater and longer-lasting.
- If technical indicators such as trend lines and moving averages offer support to price, then this is an indication that the move is down to buyers temporarily running out of steam. The buyers are there, just at lower price levels. If price crashes through support levels, then this could be a sign that the price change is based on something else.
How to Trade a Pullback Strategy
The obvious risk for any pullback strategy is that the price move may be more substantial than expected. A lot of the trade entry ideas relating to the strategy are based around managing that risk.
Use Other Indicators
Once price starts falling back, a lot of the market will consider buying in at certain price levels, which are denoted by other technical analysis indicators. Examples of these are Fibonacci levels and moving averages. The greater number of trading signals that align to identify a trading signal, the more reliable the trading decision.
Average Into a Position
Traditional investment methodology proposes working into a position in stages. This would involve buying at one support level and if price breaks that level, then buying at the next one. This way, the average price of a position is lower than if trading was carried out in an ‘all-in’ manner.
Set Stop Losses
Stop losses are automated instructions to trade out of all or some of a position if price reaches a certain point. They can be particularly useful for those using ‘higher highs, higher lows’, with the low points being called ‘swing lows’ or trend lines as a trading guide.
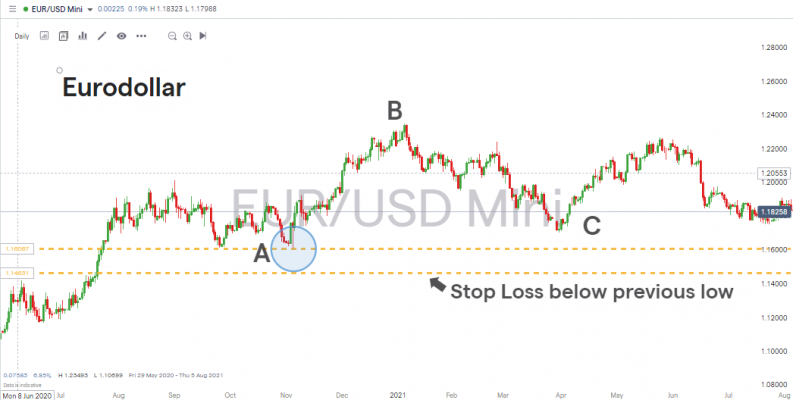
In the below example taken from the EURUSD forex pair, buying activity takes place between points B and C. The stop loss on these positions is set just below the previous higher low. If that price level is broken, then the trend will be thought of as ended.
EURUSD Price Chart – Hourly Chart Showing Swing Low and Potential Stop Loss Levels
Source: IG
While the underlying principles are as simple as buy it low, sell it high, there are a lot of factors to consider. Part of the skill of running pullback strategies is being able to identify the underlying trend and developing the skills to trade into positions effectively. This can take time, and practicing using a demo account and trading virtual funds is one way to approach the situation.
Best Pullback Trading Strategy Indicators
Pullback strategies can be used in conjunction with a range of other indicators and strategies, including:
Case Study – Using Pullback Signals With Other Indicators
The AUDUSD forex pair is often used to trade global appetite for risk. The Australian dollar thrives in times of stability and global economic growth. Its raw material trade with booming Asian economies, particularly China, drives up demand for the Australian currency as importers of iron and copper ore buy the currency to facilitate international trade transactions.
The US dollar, in contrast, is seen as more of a safe-haven asset. When geopolitical risk ratchets up, the security of holding the world’s de facto reserve currency becomes appealing for investors around the world.
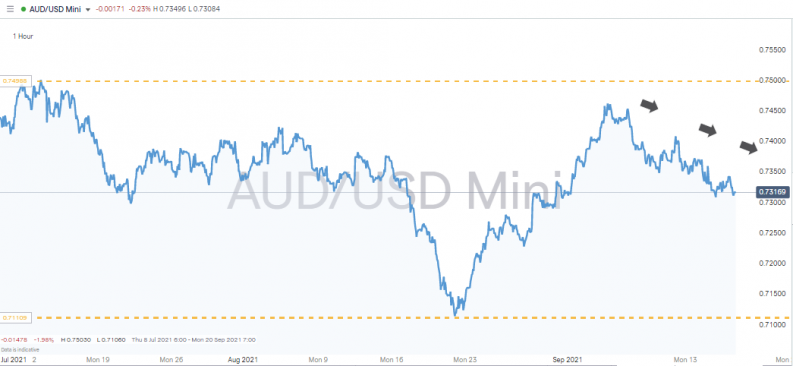
In the below chart, AUDUSD has been trading sideways through the quiet summer months. The most recent downward trend, which started near the price level 0.75 printed on 3rd September, could be one worth trading via a short position in the currency pair.
AUDUSD Price Chart – Three Months of Sideways Trading
Source: IG
If price is heading to the lower end of the trading range, the target price could be as low as 0.7114.
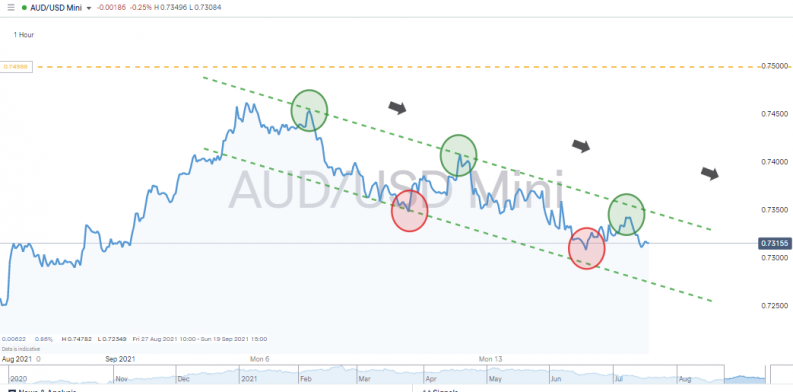
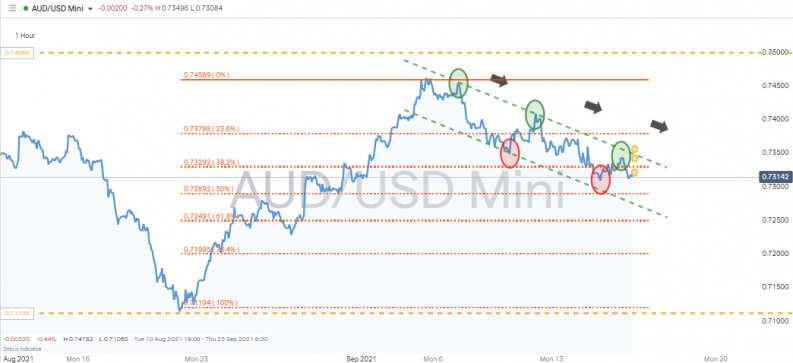
AUDUSD Price Chart – Hourly Chart Showing Recent Downward Trend Pattern
Source: IG
Zooming in on the one-hour chart, a trend-line channel is confirmed and there is a series of lower highs and lower lows. If current price can manage to trade lower than 0.730, the level of the most recent lower low, then that will be a strong indication that the swing high pattern is confirmed. Short positions could be expected to be placed with individual risk profiles determining at what level stop losses are placed. Contenders include:
- Stop loss just above 0.730
- Stop loss above the most recent high 0.734
- Stop loss above the upper green trend line, currently at 0.7347
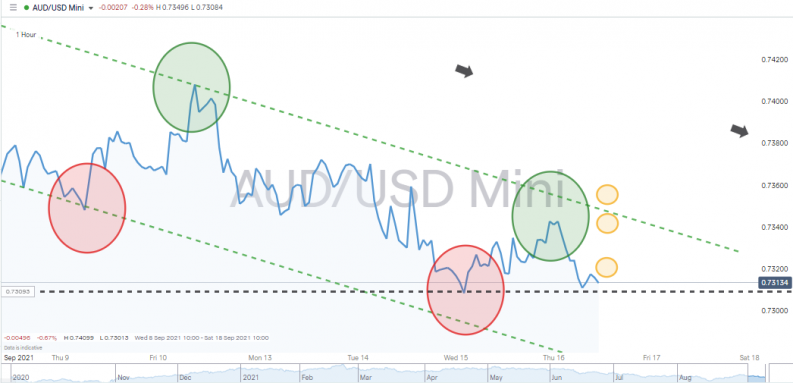
AUDUSD Price Chart – Hourly Chart Showing Recent Downward Trend Pattern and Potential Stop Loss Levels
Source: IG
Target prices could include:
- Target 1 – 0.72892 the 50% Fib level on the last move from the bottom of the price range
- Target 2 – 0.72491 the 61.8% Fib level on the last move from the bottom of the price range
AUDUSD Price Chart – Hourly Chart Showing Recent Downward Trend Pattern and Fib Levels
Source: IG
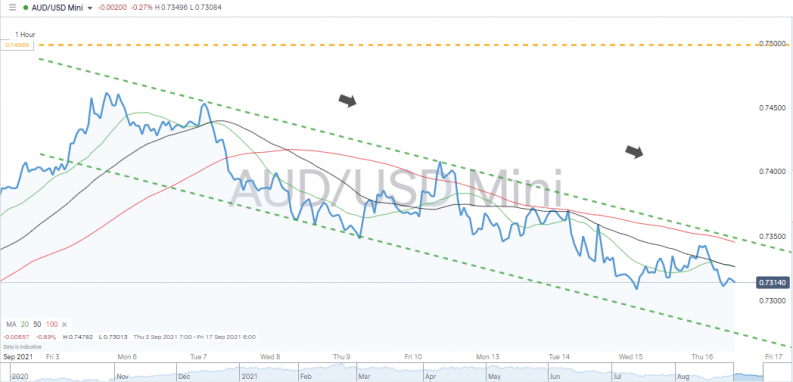
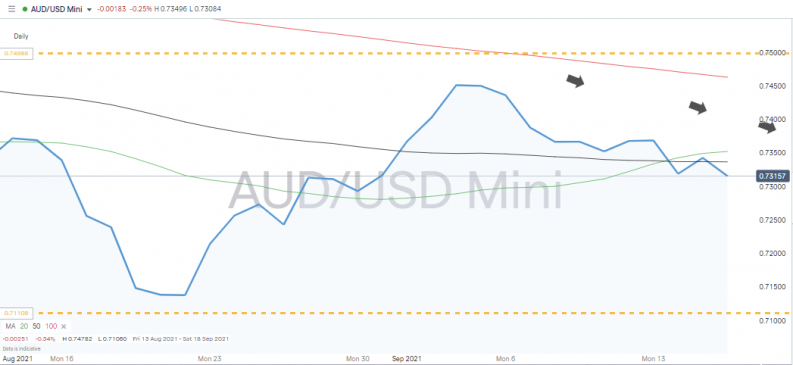
Additional confirmation that the downward trend might continue is provided by the simple moving averages of the one-hour and one-day price charts all being above current price. Those ever-shifting price levels would provide resistance to any upward move.
AUDUSD Price Chart – Hourly Chart Showing Recent Downward Trend Pattern and One-Hour SMAs
Source: IG
AUDUSD Price Chart – Daily Chart Showing Recent Downward Trend Pattern and Daily SMAs
Source: IG
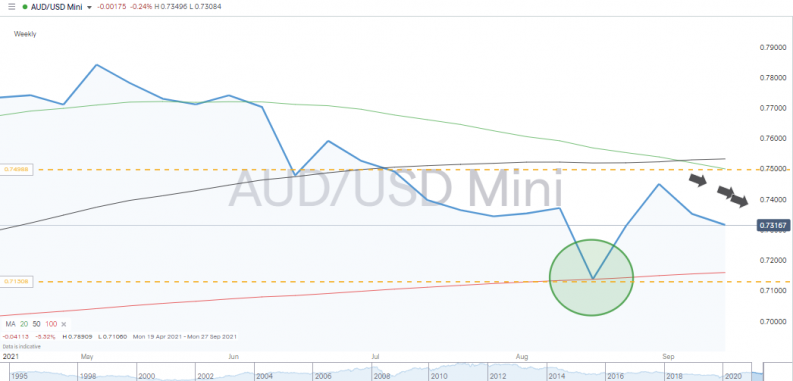
The SMA on a Weekly timeframe illustrates that the 100 Weekly SMA provided resistance to the last downward move and so helped form the lower level of the three-month trading range. [Green circle in the below chart.]
AUDUSD Price Chart – Weekly Chart Showing Support From Monthly SMAs
Source: IG
The 100 Weekly SMA is rising, but only gradually. Currently at 0.71605, that metric looks to be having a considerable influence on price, so would potentially limit the chances of price breaking through the 0.730 support, or potentially even reaching it if it can be expected that the SMA continues its gradual upward movement.
Advantages of Trading Pullback Strategies
- A well-established strategy that makes intuitive sense. If the herd is ‘buying the dips’, then follow it.
- Can be applied to any time-frame, but short-term moves tend to work better as these suggest a momentary pause in momentum rather than a fundamental change in mood.
- Can be traded in any asset group or instrument.
- Waiting for pullbacks rather than succumbing to FOMO can help build trading discipline.
- Catching a trend early on and holding the position for an extended period of time can lead to significant gains.
- More active traders can also trade the reversion.
- Go long or sell short. Pullbacks can be spotted in upward and downward-trending markets.
Disadvantages of Trading Pullback Strategies
- Spotting a trend is all important and not as easy as it might appear.
- A pullback can easily be a more significant change in market direction. It is difficult to establish if a price move is indeed going to be short-lived or the start of something more intense.
- Paradigm shift – fundamentals do change, so analysis of news events is required to establish the nature of the move.
- Technical indicators in general have their limitations. As a lagging indicator, one based on past activity, pullback strategies are exposed to the common problems, which explains why technical indicators fail.
- Trade with the trend, not against it.
- All periods of market momentum eventually fizzle out – which explains the market adage ‘the trend is your friend until the bend at the end’.
The Bottom Line
One of the major benefits of pullback strategies is that those who manage to catch a trend, and resist the temptation to sell too early, can make significant returns. Learning the skills to spot trends and developing the discipline to trade with them, not against them, is one of the first steps towards successful trading. Trend reversal signals such as a break of the swing low pattern also offer clear clues when momentum has turned and exiting a position is likely to be a good option.
The major risk and one that is unavoidable is that what looks like a short-term pullback could be something much more substantial. This means that pullback strategies are most effective when incorporated with other indicators.
Pullback strategies are widely used and are less about having a secret strategy that will beat the market and more about trading in line with the rest of the market, which is always a good idea.
Further Reading
- Read here to learn about how pullbacks form part of more advanced strategies such as Elliott Wave theory.
- This article helps readers to use Fibonacci levels to spot trade entry points on pullbacks.
- Head here to find out how failed pullbacks become potential breakout opportunities.
- Reasons why pullback strategies fail are discussed here and include the infamous dead cat bounce.


