
The double bottom pattern is the bullish version of a double top and can form at the end of a downtrend or bearish correction within an uptrend.
These formations consist of two bottoms at or near the same level with a peak between them, which creates what is called the neckline. Most traders will only consider this bullish chart pattern to be complete once price breaks and closes above the neckline.
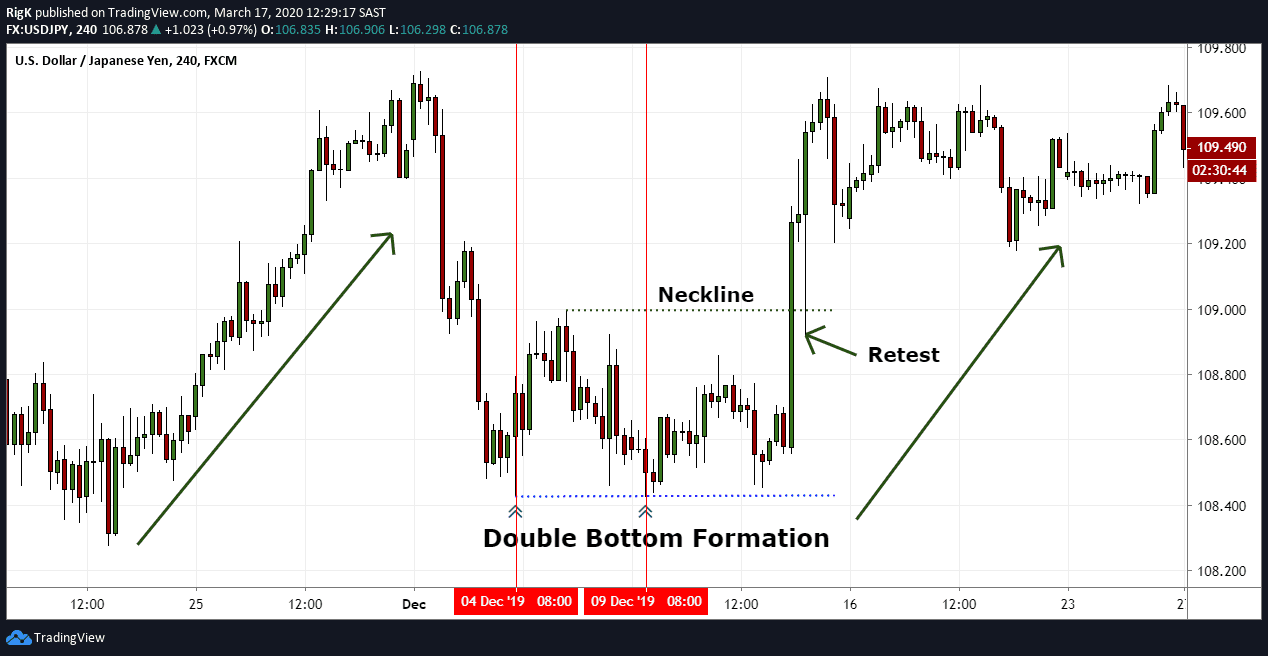
The chart example above was taken from a 4-hour chart of the USD/JPY forex pair after a bearish correction. Price initially found support on the 4th of December 2019, created a peak and retested the previous low on the 9th of December and never managed to close below the previous low.
The US Dollar then strengthened against the Japanese Yen and a few days later broke above the neckline and continued higher. Price even retested the neckline which could have presented another buying opportunity.
Aggressive traders will often attempt a long position before the neckline is broken with a stop below the recent low but conservative traders, however, will require more confirmation that a bullish trend has resumed, by waiting for a break and close above the neckline level.
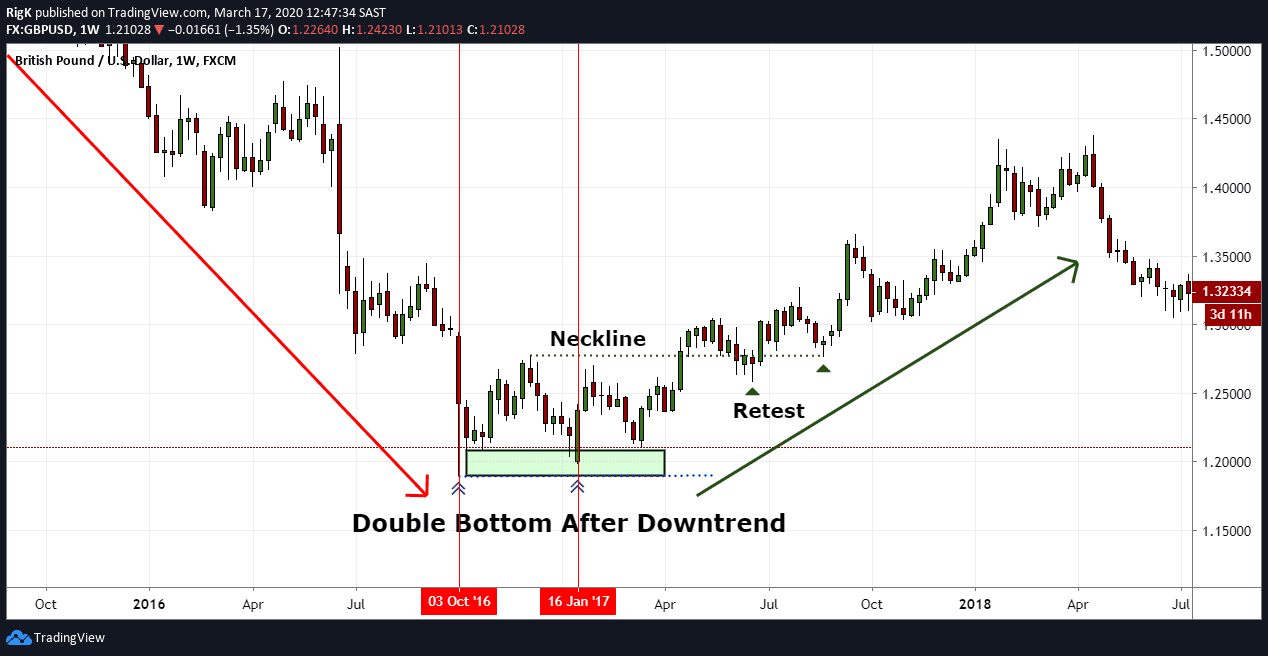
The second chart example was taken from a weekly timeframe of the GBP/USD after an extended downtrend. Note that the second bottom in January 2017 never reached the exact bottom made back in October 2016 but that the opening price at the secondary bottom was the lowest that price went and fell within a zone where previous lows were made.
What this example shows us, is that the markets will not always give you “picture perfect” double bottoms and that this occurrence can still be classified as a double bottom.
After the secondary bottom, GBP/USD broke and closed above the neckline, tested the neckline on two occasions and went higher for more than a year.
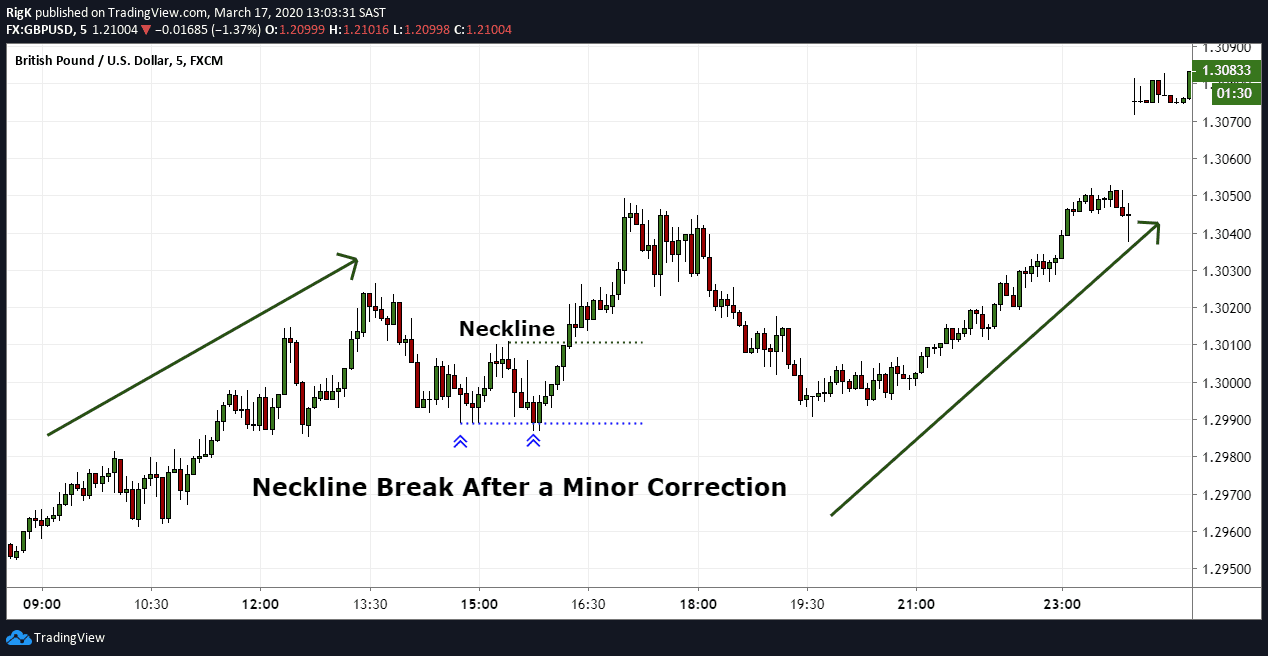
My final chart shows a recent example of a double bottom pattern after a correction on a 5-minute chart, followed by a break and close above the neckline. Here is another example where both bottoms did not end at exactly the same level but price at the second bottom could not manage to close below the first bottom’s level.
Whenever you are unsure that a double bottom pattern has completed, like in the final two examples, then in most cases it would be a good idea to wait for a break above the neckline to confirm the completion of this bullish reversal pattern.
These examples have shown why the double bottom pattern is such a powerful bullish trading setup that can appear on any timeframe, making it the perfect pattern to follow regardless of your trading style or approach.
PEOPLE WHO READ THIS ALSO VIEWED: