
The double top is a very popular trading pattern which generally leads to a bearish reversal after a bullish trend or correction ends.
These formations consist of two tops at nearly the same level with a valley or through between them, which creates what is called the neckline. Most traders will only consider this bearish pattern to be complete once price breaks and closes below the neckline.
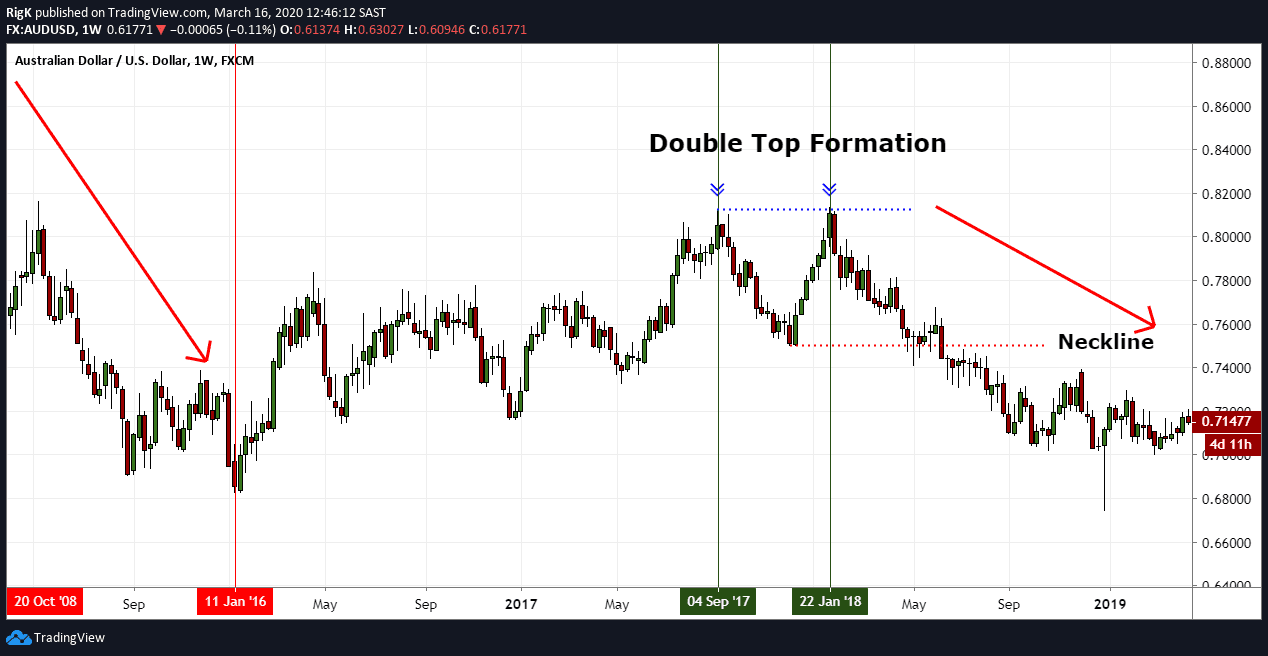
The chart above shows a picture perfect double top pattern on the AUD/USD forex pair after a long-term correction ended in January 2018. Note how price failed to close above the September 2017 high and immediately reversed lower.
This price behavior signaled weakness as the bulls failed to carry price higher, with the bears taking immediate control afterwards.
Aggressive traders will often attempt a short before the neckline is broken with a stop above the recent high. Conservative traders however will require more confirmation that a bearish trend has started or resumed, by waiting for a break and close below the neckline level.
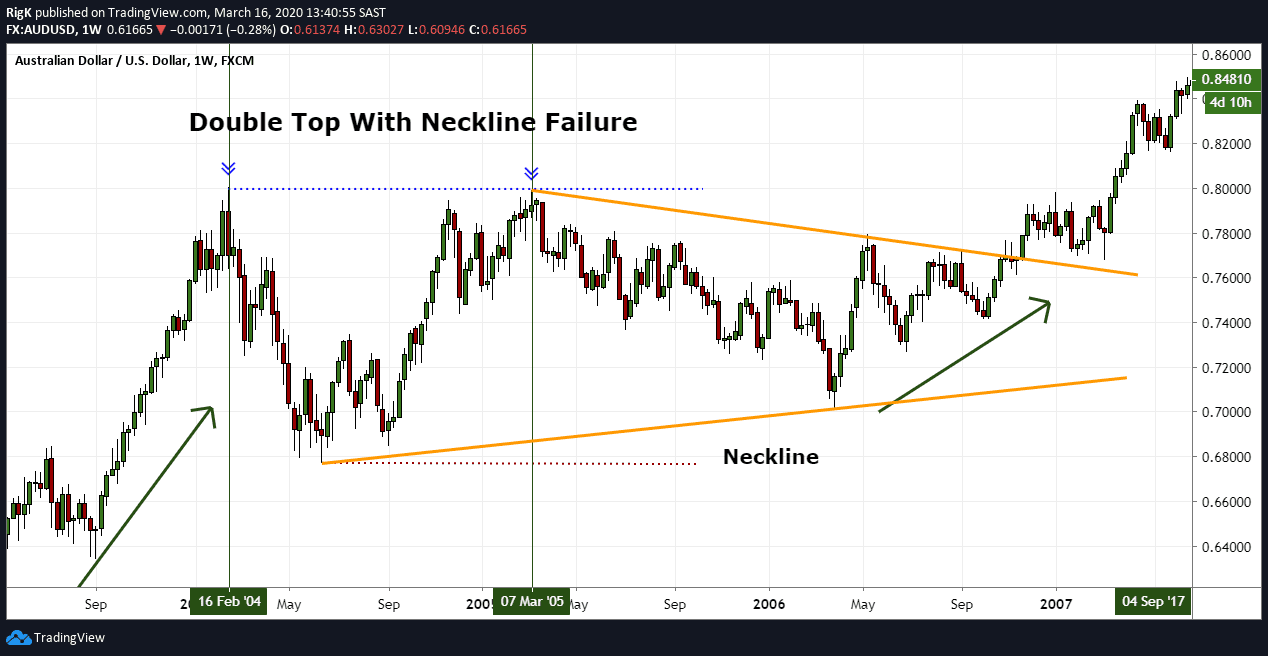
Here is another example of a double top pattern on the AUD/USD forex pair, but this time around price failed to break the neckline after the second top. Instead, price started trading sideways and formed a symmetrical triangle pattern.
Although the second example was taken from a weekly timeframe, it is important to understand that these double top patterns occur on all timeframes and that it is up to each individual trader to decide whether they want to approach these formations aggressively or wait for a break of the neckline first.
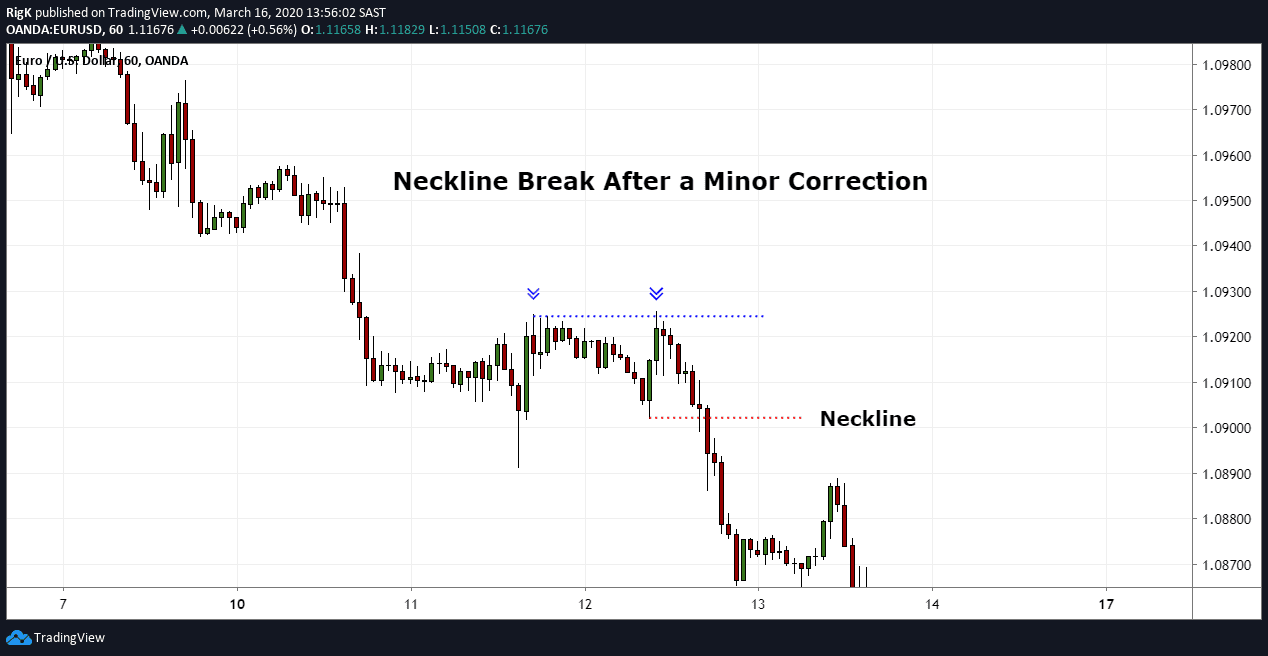
My final chart shows a double top pattern followed by a break and close below the neckline on a 1-hour chart of the EUR/USD. Many traders would tell you that the secondary top was the end of some sort of correction but the problem is that no-one would have known that the secondary top was the exact end of that minor correction until price action confirmed it by breaking below the neckline.
This is why waiting for a break of the neckline is so powerful because price structure confirms that it wants to move lower and in many cases this approach will keep you on the right side of the market.
These examples have shown why the double top pattern is such a powerful bearish trading setup which appears on any timeframe, making it the perfect pattern to follow regardless of your trading style or approach.
PEOPLE WHO READ THIS ALSO VIEWED: