
In this article, we will define what moving averages are, explore the three main types of moving averages that are used by traders and investors, and delve into how they are calculated. We will then focus on how you can use moving averages in your analysis of market trends, to define support and resistance levels and to produce trading signals.
- Moving Average Defined
- Types Of Moving Average And How They Are Calculated
- Trading Tactics Using Moving Averages
- Moving Average Trading Summary
Moving Average Defined
Random price fluctuations that constantly occur in markets can often make it difficult for traders to spot trends and predict market movements accurately. To help with this, many traders use a technical analysis tool called a moving average, which filters out the ‘noise’ in the market. This ‘moving average’ levels out the price action, making it easier to spot trends, resistance levels and predict the market as a whole, informing the trader when to buy and sell.
Moving averages can be used with all different types of markets and asset classes, whether that be stocks, forex, equity indices or commodities. In each case, it is calculated by setting a time period and taking an average of the market price over it. Different traders have differing goals, styles, and strategies, which will significantly impact what type of moving average they choose to employ.
Types Of Moving Average And How They Are Calculated
There are multiple types of moving average that traders use in their strategy that all behave slightly differently depending on how they are calculated. The most commonly used of these are below, which we will explore in more detail.
- Simple Moving Average (SMA)
- Weighted Moving Average (WMA)
- Exponential Moving Average (EMA)
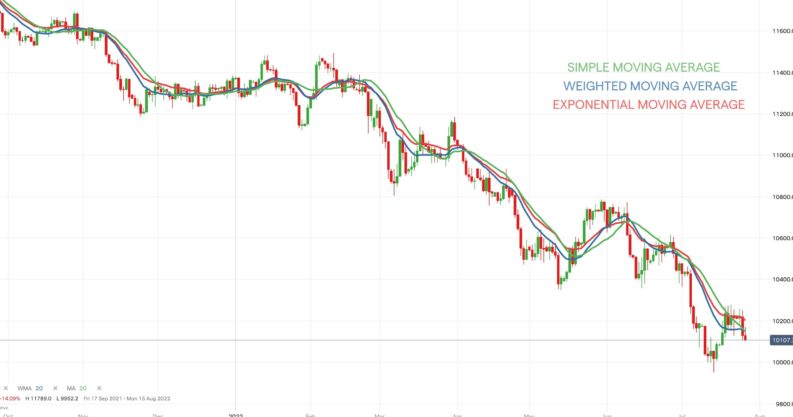
Source: IG
Simple Moving Average (SMA)
As the name states, the most basic of the three is the simple moving average (SMA), which is calculated by taking the mean average of the previous many data points. Due to its simplicity and useful information it provides, it is very popular with traders.
Notation
For a dataset of n equally spaced data points, a SMA is calculated by:
SMA = (P1 + P2 + …… + An) / n
Where Pi is the data point in the ith period
Weighted Moving Average (WMA)
Now we move on to the slightly more complex weighted moving average (WMA) that is often useful in quicker response trading, such as for trend-tracking purposes. This is because it places more significance on the more recent data points by giving each point decreasing weights as you go back in time. This allows the trader to react faster to current events that affect the markets as the average is more responsive to these more recent price moves.
Notation
For a dataset of n equally spaced data points, a WMA is calculated by:
WMA = (P1*W1 + P2*W2 + …… + Pn*Wn)/ n
Where Pi and Wi are the data point in the ith period and weighting respectively.
Exponential Moving Average (EMA)
Much like the WMA, our final type of moving average also reacts to more recent data faster than an SMA. This is because an exponential moving average (EMA) also weights the more recent data but does so on an exponential curve throughout the dataset. This means it often reacts even faster than the WMA to events, with the notation for this being slightly more complex.
Notation
For a dataset of n equally spaced data points, an EMA is calculated by:
EMA = (C – P) * (2 / (n + 1)) + P
Where C and P are the current data point and an exponential moving average of the previous period, respectively (SMA used for the first period).
Trading Tactics Using Moving Averages
There are different ways in which traders can employ these moving averages for their benefit. The most popular tactics are:
- Market Direction
- Moving Averages as Resistance and Support
- Signals from Multiple Moving Average
Market Direction
As the name suggests, the trend direction tells us what way the market has been moving on average over the time period. Depending on our dataset, we will either see a long-term, medium-term, short-term, or even intraday trend (especially in the cases of the WMA and EMA), of which these trends will point upwards, downwards or simply sideways. These can all be useful depending on what we want to predict and what is occurring in the markets at the time, prompting traders to change their strategies in a different way.
Moving Averages as Resistance and Support
Some traders use moving averages heavily in their trading schemes and build them with a heavy reliance on the support and resistance concept. They will use a moving average as a baseline of reference that they receive a signal when the price breaks this average line. The price is referred to be in support of the moving average when it is above the moving average and the price in resistance when it is below the average.
When they receive this signal, it can tell traders whether to enter or exit a position, but the specifics will depend on the time frame and market. These support and resistance signals do not have to be the base of a strategy but can also be used in support, with other indicators being the main focus.
Signals from Multiple Moving Average
As we have discussed, moving averages can take place over different time periods and the specific time period is significant, even within the same market. This is crucial when looking at the case of moving average crossovers, which refers to when one moving average crosses another in the same market but of different time length. This is a very important signal for traders as it indicates a potential trend reversal.
An indicator to sell or even short a market would be when the shorter moving average moves below the longer-term moving average, as it signifies a declining market. One would then be inclined to buy if the opposite occurred and the shorter-term moving average moved up through the longer-term moving average.
Moving Average Trading Summary
You should now have a far better understanding of what moving averages are and appreciate the difference between the three main types of moving average – the simple moving average, weighted moving average and exponential moving average – and know how they are each calculated.
Moreover, we have highlighted how you can find real value by applying moving averages to your trading, in order to identify market trend direction, to use moving averages as support and resistance levels and to produce signals from moving average crossovers.
Now that you have this new trading tool, check out AskTraders’ trusted broker list to find the right broker for you to start using moving averages with your investing and trading.