
The triple top pattern is used by technical analysts to predict a reversal after an uptrend and consists of three peaks that are similar in height.
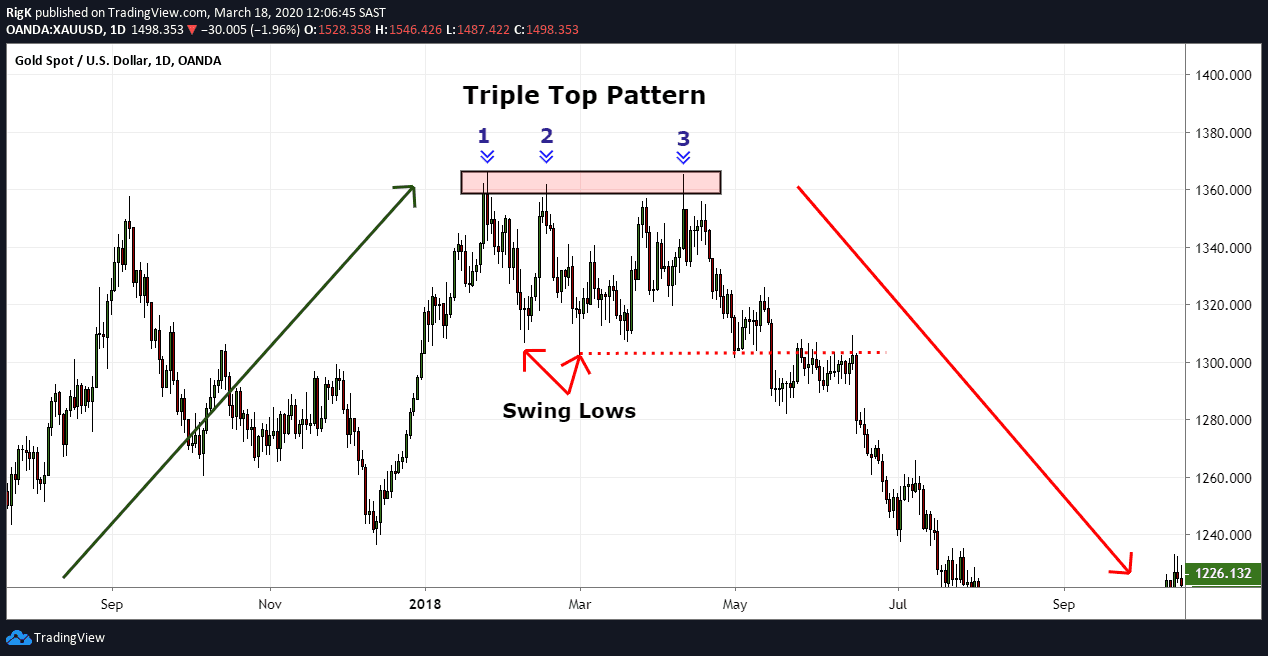
The chart above shows a great example of a triple top that formed on Gold back in 2018. After the first peak, price pulled back and created a swing low, then rallied higher again but created another peak of almost the same high than the first.
Another swing low followed and after the 3rd peak failed to break above the previous two, the pattern was nearly complete.
Traders will often wait for price to break below the final swing low to confirm that a triple top has completed and quite often the resulting move lower will be quite strong, making this a great chart pattern to follow on any timeframe.
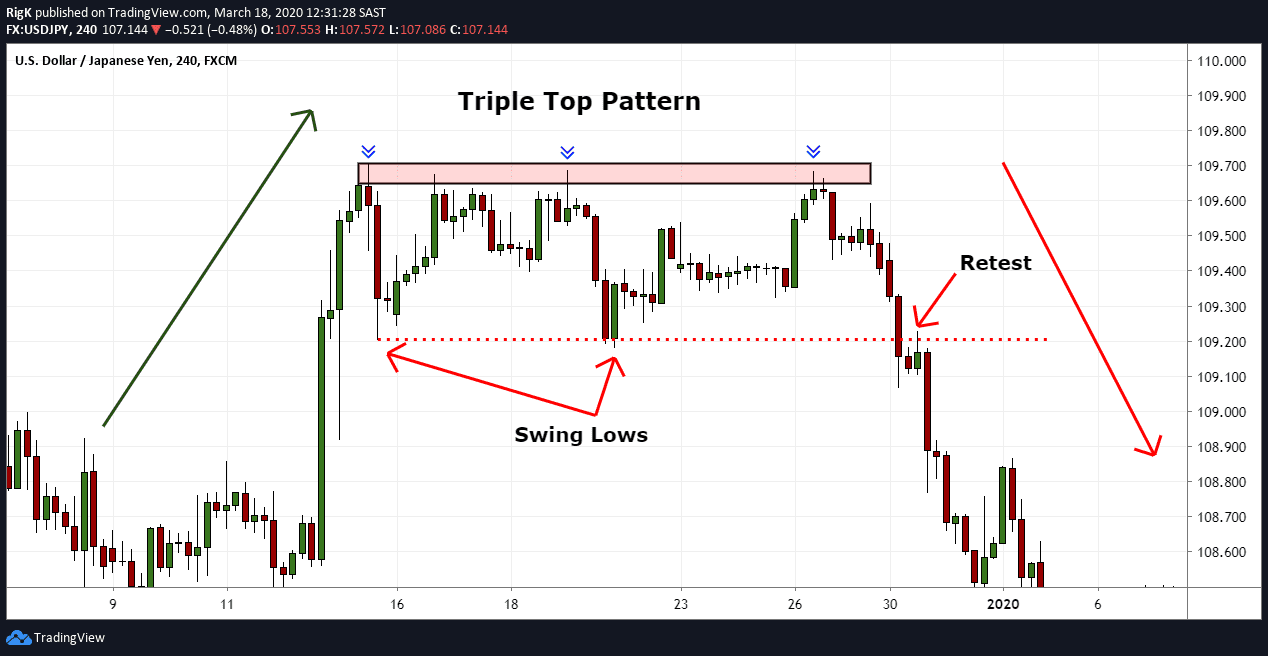
My second chart example shows another triple top pattern, but this time on a 4-hour timeframe of the USD/JPY forex pair. If you look closely, then you might say that there were four tops within the same zone where price failed to break out, but when you are dealing with a potential triple top, then your first two swing lows will often be around the same level.
As soon as the 3rd top or peak formed, price reversed lower and broke below the previous two swing lows, completing the pattern. Conservative traders will often wait for the previous swing lows to be broken before they execute short positions or wait for a retest of the swing low level.
Triple tops should however not be confused with the head and shoulders pattern which can visually look very similar to triple tops. When you are dealing with a head and shoulders pattern, then the middle peak will be higher than the other peaks but in the end, they are traded in a similar way to triple tops when price breaks below the previous swing lows.
TIPS FOR TRADERS USING TRIPLE TOP PATTERN
Another indication that a potential triple top might have completed, will be to watch volume as price trades lower. An increase in volume is generally a good sign that the buying pressure has dried up and that sellers are stepping into the downward move.
Since these patterns often result in a strong reversal, it will be a great idea to watch volume closely as price comes down because if there is a lack of selling volume, then the probability of this pattern working out could greatly decrease.
The triple top pattern is a powerful reversal pattern and appears on any timeframe but remember that not all patterns always work out and that it’s important to follow a tested strategy with strict risk control.
PEOPLE WHO READ THIS ALSO VIEWED: