Key points:
-
- Surge Sends Short-Term Bullish Signal
- Larger Basing Intact and Reinforced
- Upside Targets
A surge higher for Polkadot this week has produced a bullish technical analysis signal on the chart. This positive price action has reinforced a short-term basing and also an intermediate-term bottoming, and sets the risk for a higher price forecast.
Surge Sends Short-Term Bullish Signal
Alongside the wider cryptocurrency market, Polkadot (DOT) posted solid gains on Tuesday 25th October, also in line with a wider “risk on” theme seen across financial markets assets, led by the recent robust gains in US and global equity markets.
This broader “risk on” theme has been driven by a combination of a widely better than expected US earnings reports for Q3 and easing fears regarding global central bank hawkishness and worldwide inflationary pressures.
 WELCOME BONUS - Free Share Bundle When You Invest £50!
Get up to £500 cashback for investing with IG.
WELCOME BONUS - Free Share Bundle When You Invest £50!
Get up to £500 cashback for investing with IG.
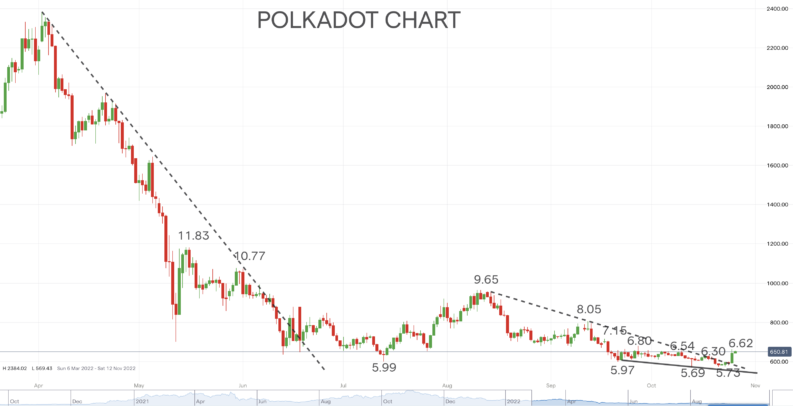
Specifically, for Polkadot, the impulsive advance from Tuesday has seen the market surge above the mid-October swing peak at 6.30, up to 6.62 to complete a Double Bottom pattern in relation to the October dual lows at 5.69 and 5.73. This is a short-term bullish reversal signal, which was reinforced by the push also above another October swing high at 6.54.
Also read: Top 10 Crypto Investors To Follow On Twitter
Larger Basing Intact and Reinforced
Tuesday’s rally also saw Polkadot reverse up through the down trend line from mid-August (off of the 9.65 peak through the mid-September high at 8.05) for a more significant, intermediate-term bullish signal. This positive price action has seen a confirmation of a large bullish falling wedge pattern, reinforcing the intermediate-term bottoming pattern that has been building not just from late September, but also since the Q1-Q2 bear market low was posted at 5.99 in mid-July.
This broader basing activity points to a more sustainable bottom and recovery for not just the short-term, but also for the intermediate-term recovery, and even into the longer-term.
Upside Targets
The upside targets for late October and early November are the late September peak at 6.80 and then the 7.15 level. Through here for November would open up a higher swing target at 8.05. Going out into year-end, the threat will be for a more robust advance closer to the August swing high at 9.65.
Should the DOT market revert back to the downside, the risk will be for a challenge down to the October dual lows at 5.73/69. Surrender here would then open up risks for latter 2022 down to 5.50, even as low as 3.50.
