The Falling Wedge Pattern Explained
The falling wedge pattern is followed by technical analysts because it typically signals a bullish reversal after a downtrend or a trend continuation during an established uptrend.
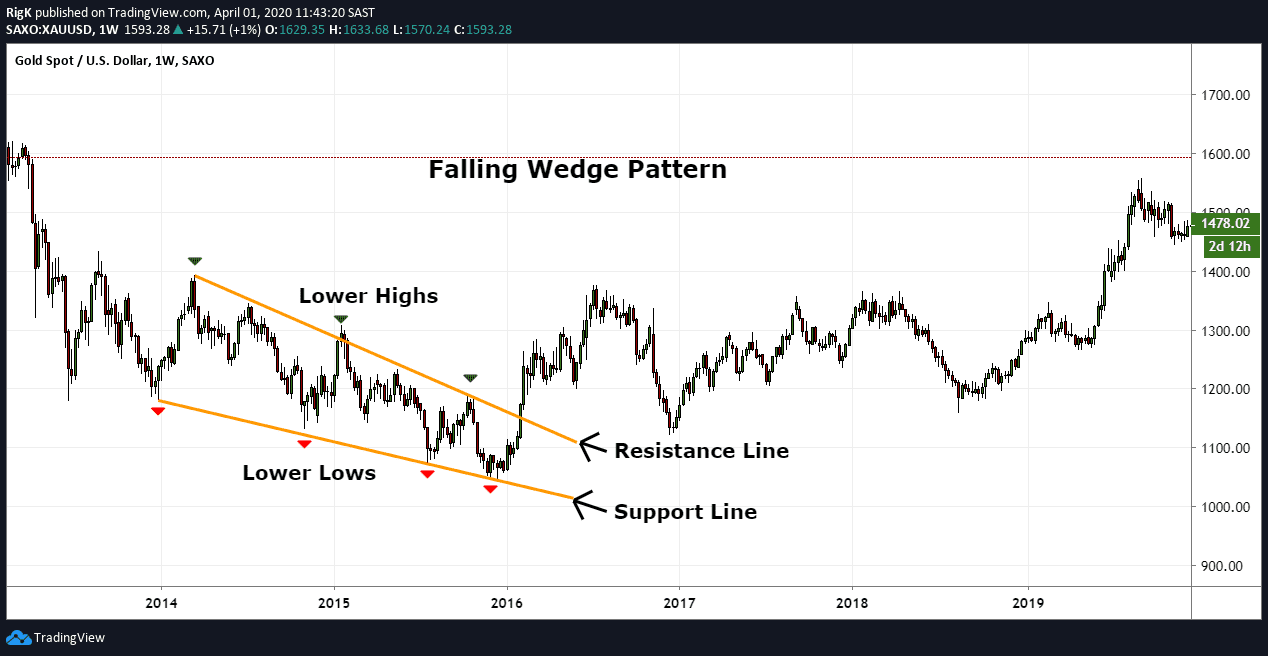
A falling wedge can be defined by a set of lower lows (support) and lower highs (resistance) that slope downwards and contract into a narrower range before price finally breaks above the resistance line and a change in trend direction occurs. Another notable characteristic of a falling wedge is that the upper resistance line tends to have a steeper descending angle than the lower support line.
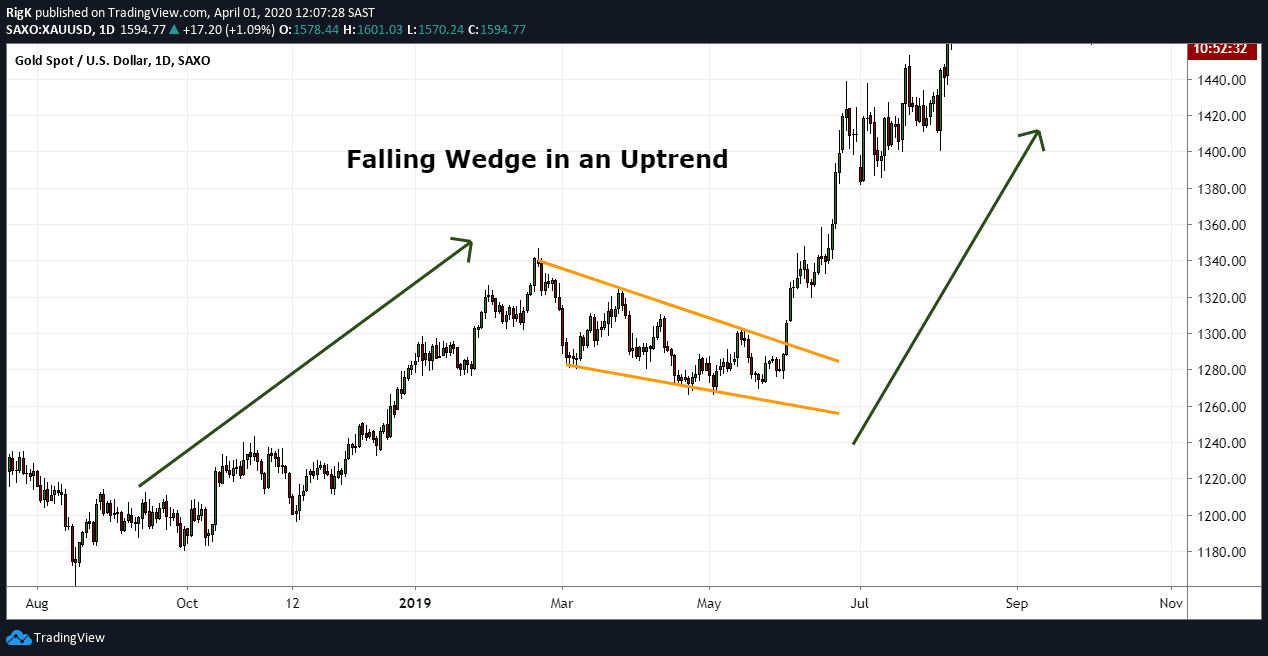
Here is another example of a falling wedge pattern but this time it formed during a corrective phase in Gold which signaled a potential trend continuation once the pattern completed.
How to Trade the Falling Wedge Pattern
Because the falling wedge is a bullish chart pattern, aggressive traders will typically wait for price to break above the upper resistance line before they will execute a long position. Conservative traders, on the other hand, will generally wait for price to retest the upper resistance line from above before they will execute a long trade. Just keep in mind though, that a retest of the breakout level might not always happen and result in a trader missing an entry.
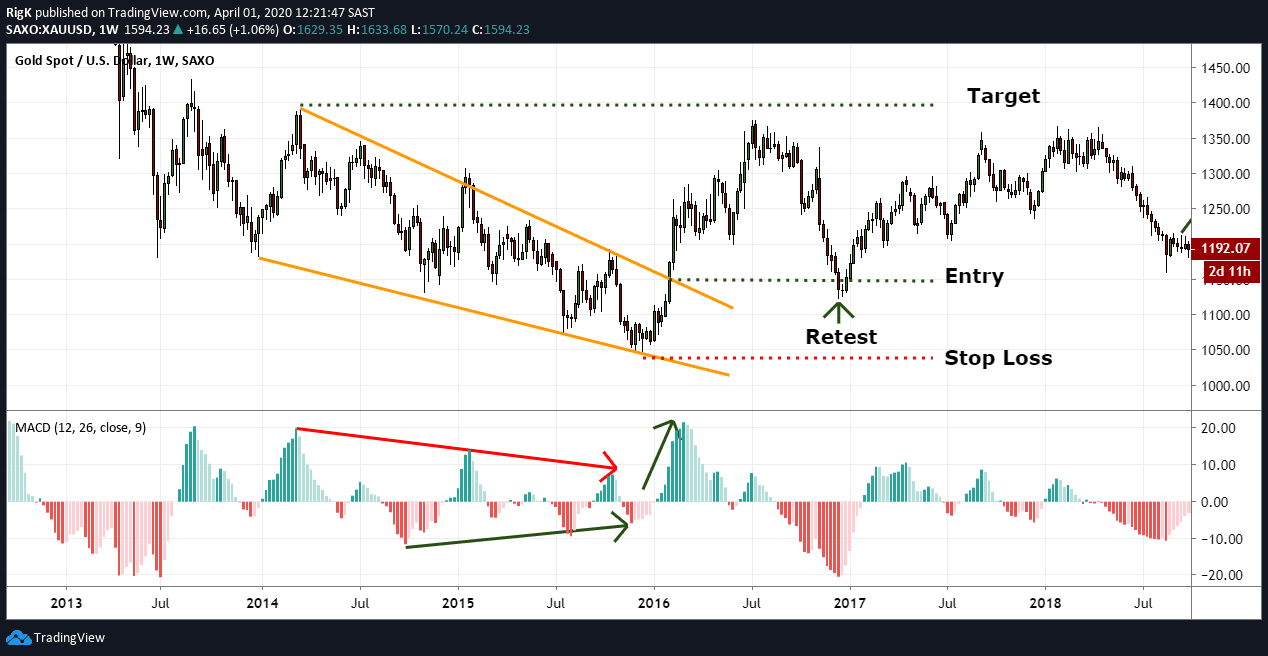
The ideal place to set a target will be at the upper level where the falling wedge started from, with a stop loss a few pips below the final low before the breakout occurred.
Traders Tip: When you are following a falling wedge in real-time, it can be a good idea to watch for momentum divergence on a MACD-Histogram between the lower lows, and use it as an additional confirmation method that a falling wedge might be nearing an end. Once this pattern ends there will usually be an increase in momentum once price breaks above the resistance line.
Note that the example above also shows a decline in the MACD-Histogram’s peaks before the patter ends. This occurrence does not necessarily always happen but is another confirmation signal to look out for since the MACD-Histogram also showed a wedge-like formation.
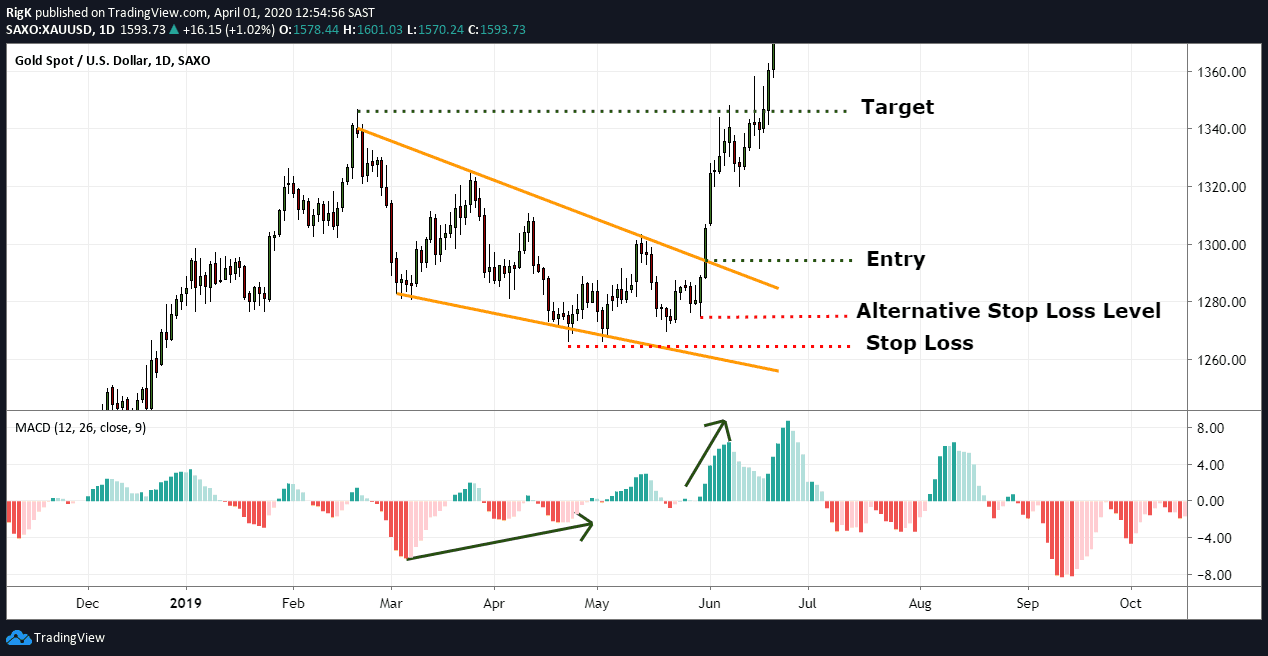
My final chart shows the same falling wedge in Gold that led to a trend continuation when it ended. This is a great example where conservative traders would not have had an opportunity to enter if they waited for a retest of the breakout level.
That being said, there was additional confirmation that this falling wedge was about to end when the MACD-Histogram started picking up momentum divergence between the lower lows at the support line.
Also note how momentum increased dramatically once price broke above the resistance line, which signaled an end to the pattern. A target could again have been placed at the level where the rising wedge started from with a stop loss below the final lower low.
Always make sure that your potential reward is larger than the risk you are taking on and if your stop loss ends up being too far away, then consider placing your stop below a previous swing long that was formed on the way up before the resistance line was broken.
The falling wedge is a bullish pattern, whether it forms after an established downtrend or during an uptrend, so the next time you spot this pattern on your favorite market exercise caution if you are holding a short position or prepare for an opportunity to get long.
PEOPLE WHO READ THIS ALSO VIEWED: