
What is Parabolic SAR?
The Parabolic SAR is a technical indicator used to confirm the price direction or direction of a trend on any particular asset. It also helps to signal when a change in trend may occur, hence the SAR part of its name. It’s the ideal tool for those with an aggressive trading style or traders who prefer scalping.
As you can see in the picture below, on the chart, the indicator shows plots or a series of dots in various lengths and amounts…
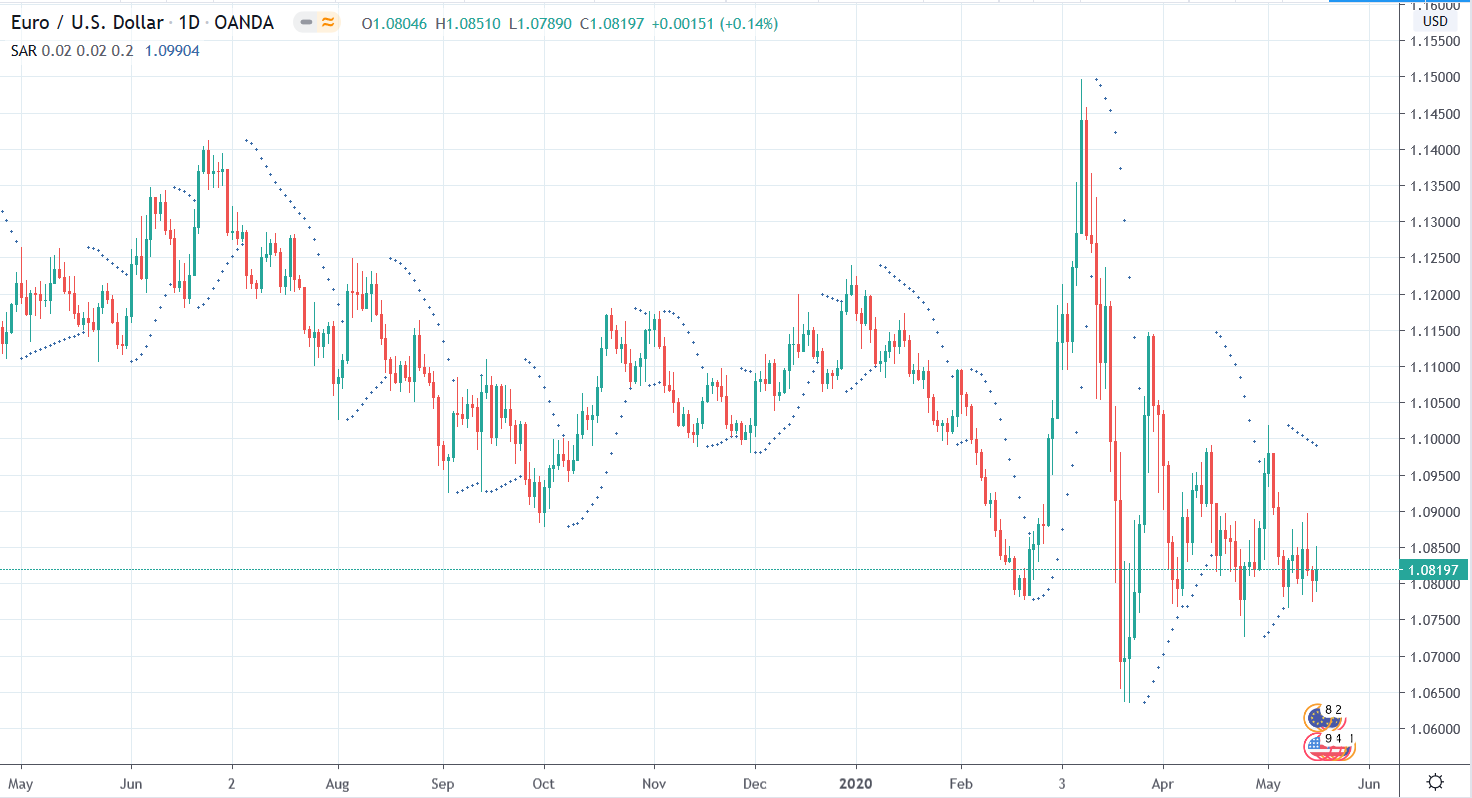
If the dots are below the current price action, this indicates that price is in a bullish trend. Alternatively, if the dots are above the current price action, then this shows a bearish trend.
If there is a change and the dots move from below the current price to above, this will signal a change in trend. It has now flipped from bullish to bearish. The beginning of the new set of dots will always start at the low or highest high of the latest trend.
Another thing to take note of is that as a trend gains momentum, so will the plots on the indicator. They will widen as the trend becomes stronger, which you can see in the below chart.
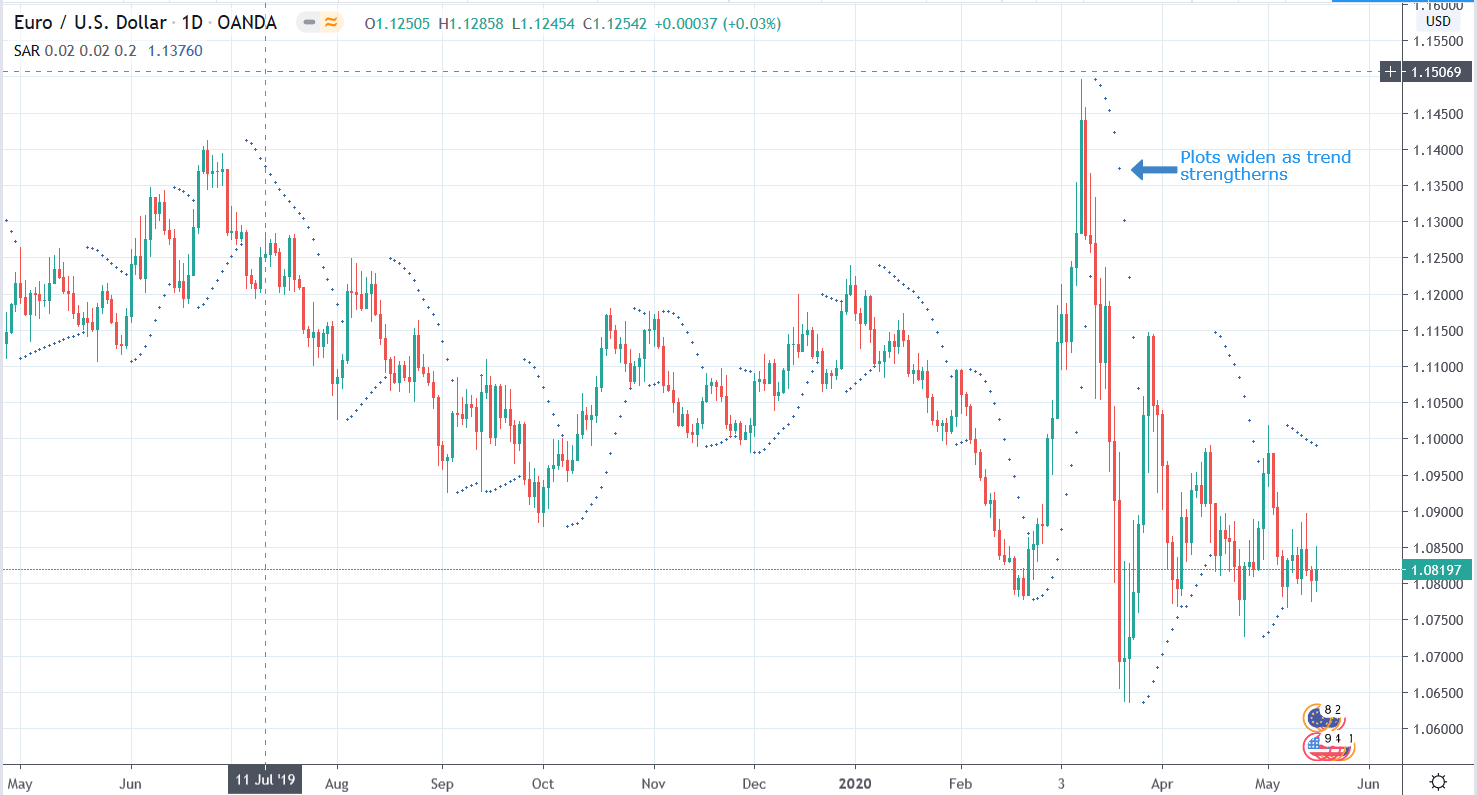
If the dots begin to close, it signals a weakening trend.
How to use Parabolic SAR
You can use the Parabolic SAR as a method to enter trades, set stop-loss orders or even take-profit orders…
An example of its use would be entering on the change of a trend. Now, we don’t suggest you use the Parabolic SAR as a standalone strategy. However, you could use it in conjunction with another indicator, such as a moving average…
If you have a sell bias on the EURUSD, for example, you could wait for a change in direction (and confirmation on another indicator) and once you get that change, enter your position. You could then also set your stop-loss above or below the first plots.
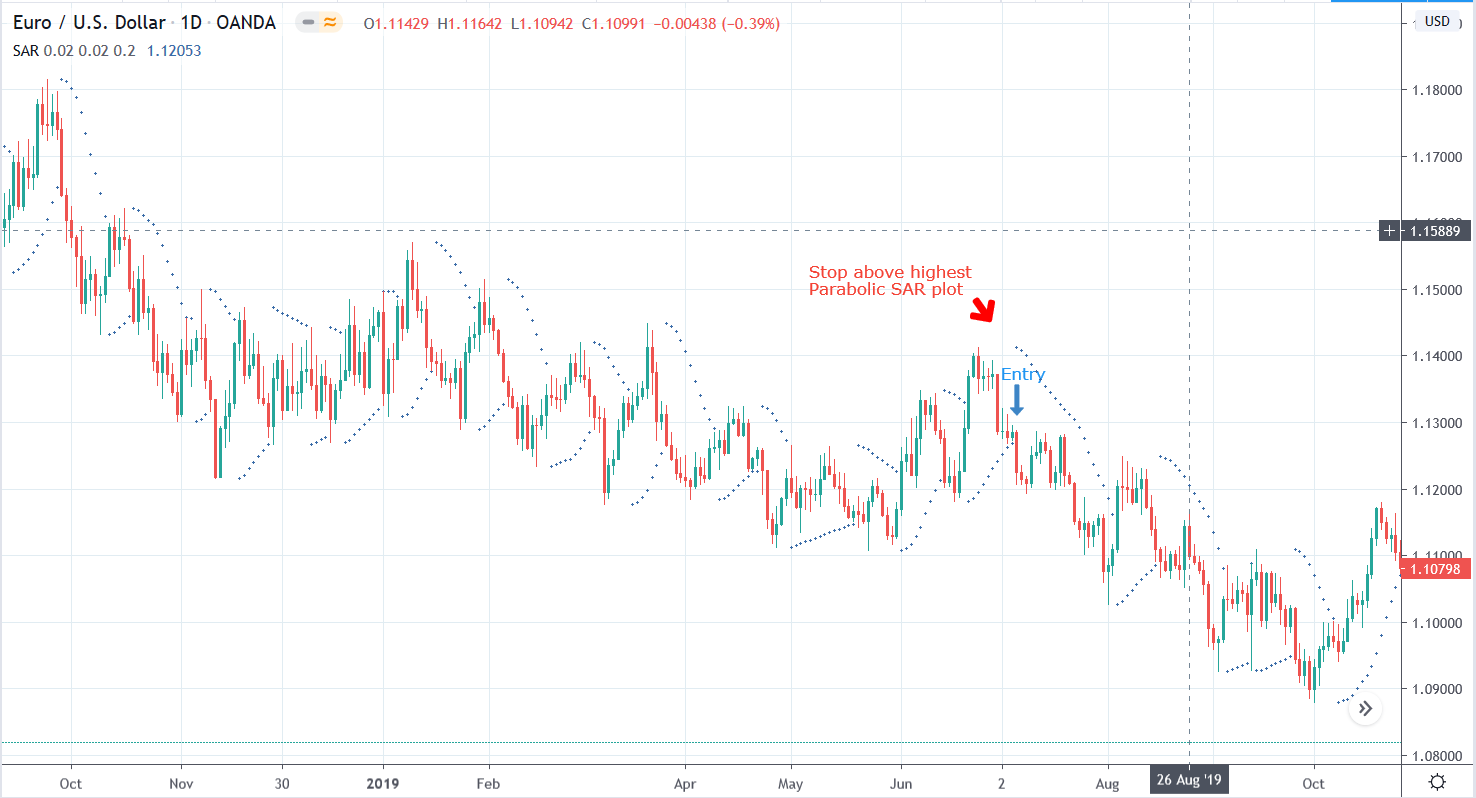
If you wanted to set a take profit, you could base it on either waiting for a potential reversal, or the closing of the dots which signals a weakening trend.
You could also use a trailing stop to track the indicator and use that as your take profit as well. Only exiting the trade when your trailing stop is hit, making sure you make the most of a sustained trend.
Advantages
As you can see, there are a fair few advantages of implementing the indicator in your trading strategy:
- The first of which being that it helps to determine a trends direction and potential reversals in price.
- It also helps to identify potential entry and exit points.
- Finally, it helps to identify the strength of a trend based on the space between the plots.
Disadvantages
As with most indicators, for all the positives they provide to a strategy, there are also negatives:
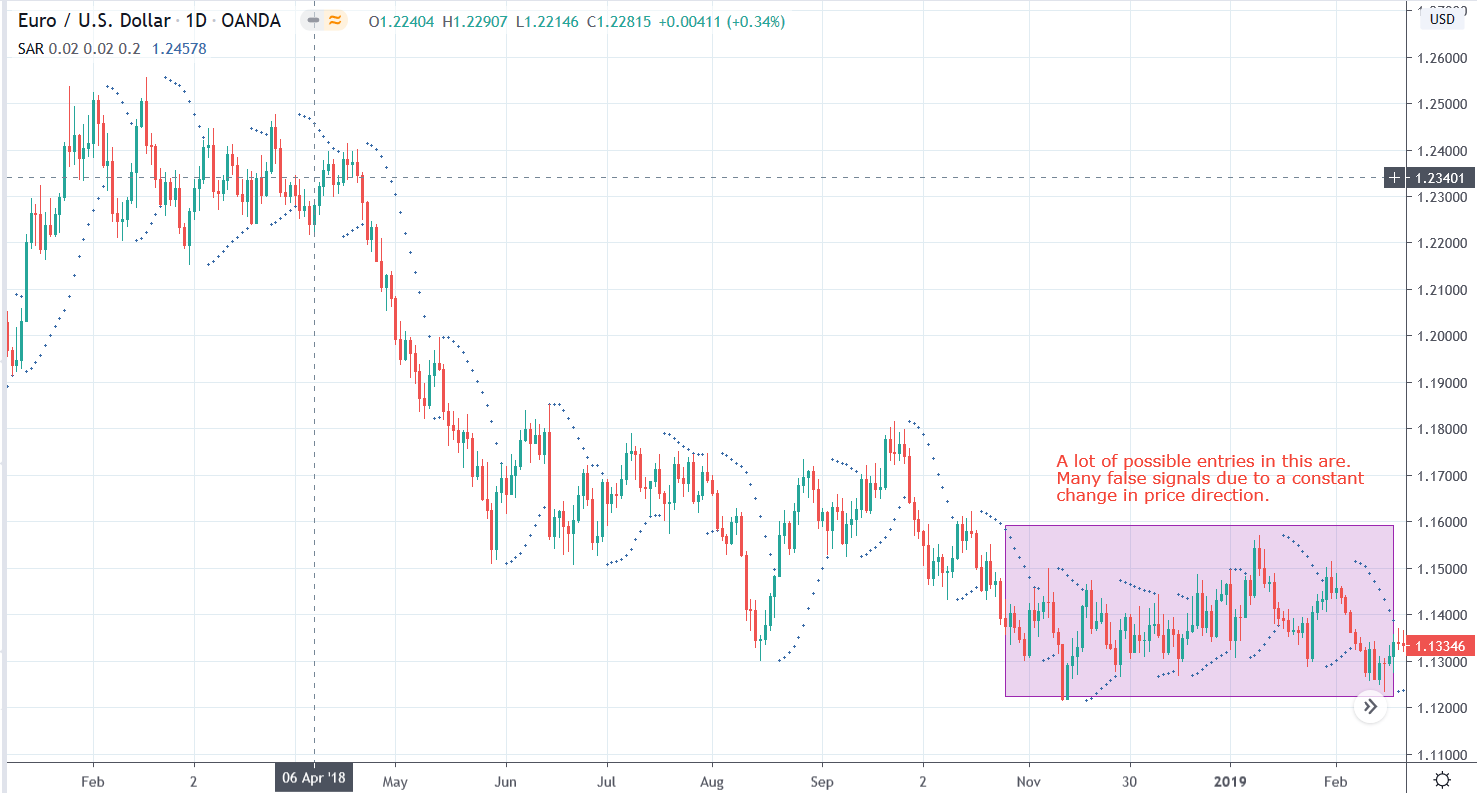
- The main negative of the Parabolic SAR is that it will give out many false signals. These false signals are especially prevalent in a choppy or sideways moving market.
- If you take a look at the graph below, you can see that basing your strategy solely on this one indicator can put you through periods of many small losses, if you took every signal as an entry. One way around this could be to only enter the buy signals during an uptrend.
Conclusion
All in all, we really do like this indicator as an extra tool to use to confirm directional bias.
However, as we mentioned, it can give many false signals, and it is up to the trader to pick which signals they should take action on.
We definitely recommend it as a way to judge where to place stop-losses, but urge traders to use other tools alongside the Parabolic SAR to prevent false signals and fakeouts.
PEOPLE WHO READ THIS ALSO VIEWED: