The rounding bottom pattern is used in technical analysis to signal the potential end of a downtrend and consists of a rounded bottom-like shape with a neckline resistance level where price failed to break through on numerous occasions.
YOUR CAPITAL IS AT RISK

This pattern is considered complete once price finally breaks and closes above the neckline.
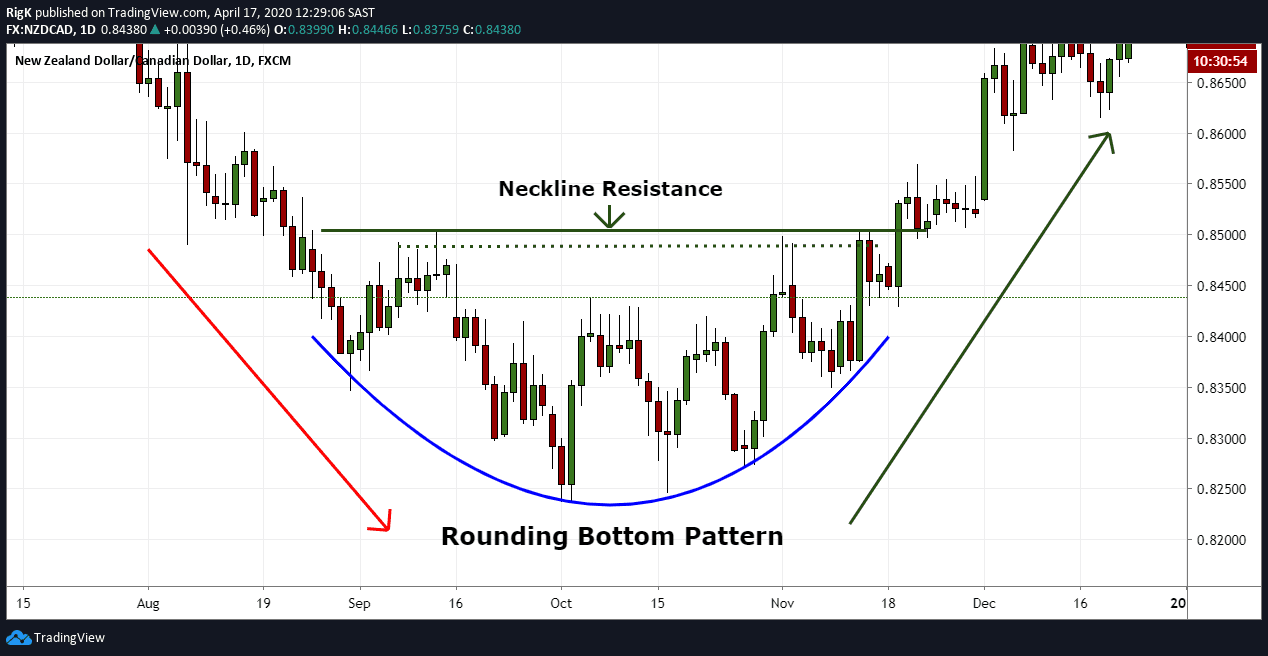
Image 1: NZD/CAD – Daily Timeframe
Sometimes this formation can coincide with a double or triple bottom pattern but the main point to consider here is that a potential change in trend could occur and that traders should, therefore, exercise caution if they are holding short positions and perhaps even prepare to go long once price breaks above the neckline resistance level.
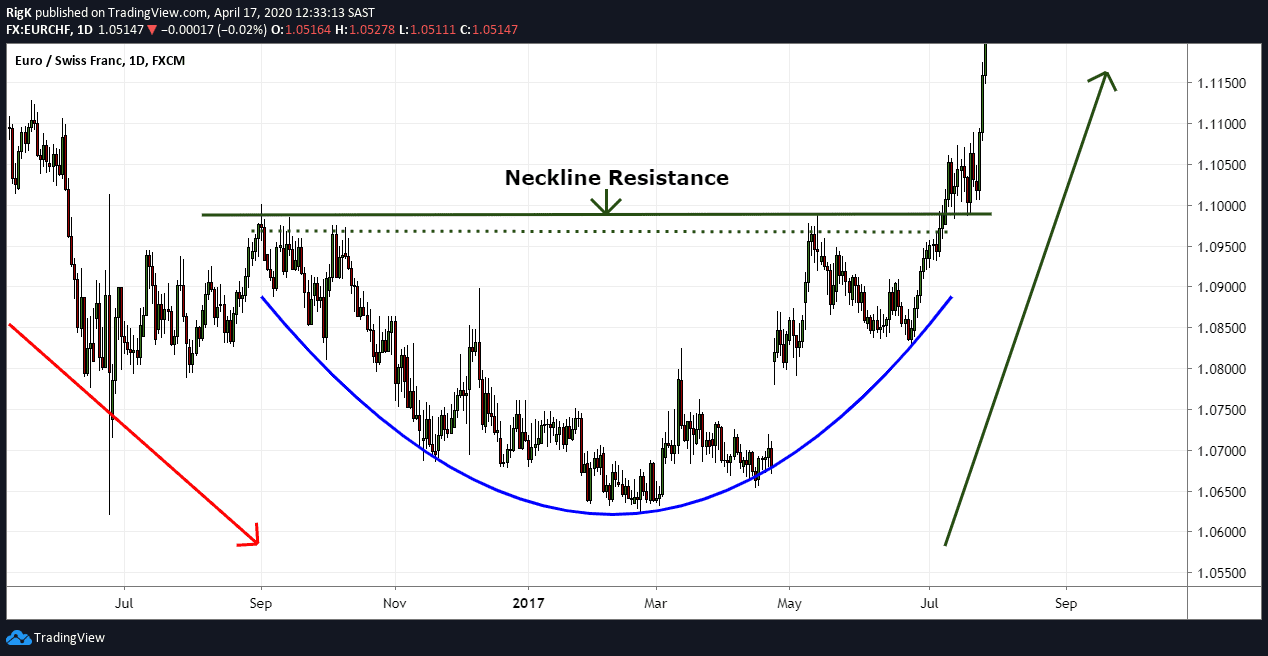
Image 2: EUR/CHF – Daily Timeframe
Here we have another example of a rounding bottom pattern on the EUR/CHF currency pair that took about 5 months to complete. Note how price moved sharply higher in both these examples once the neckline resistance level was broken. This price behavior is a common occurrence once these patterns complete.
YOUR CAPITAL IS AT RISK
How to Trade the Rounding Bottom Pattern
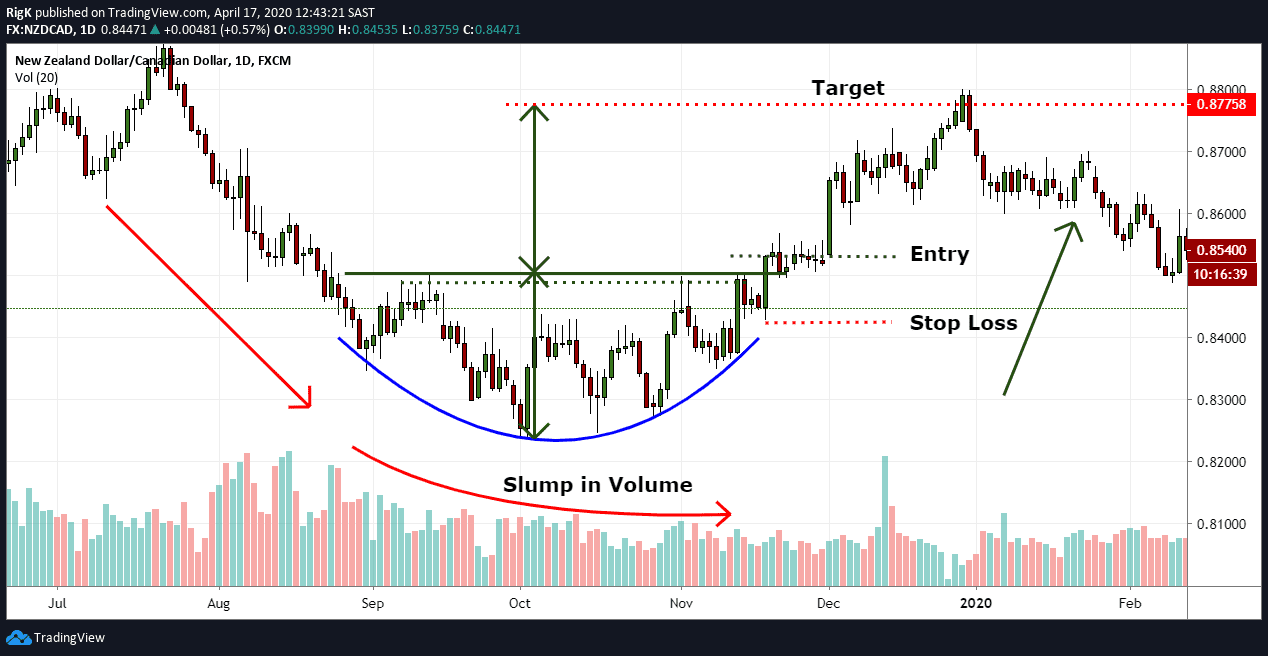
Image 3: NZD/CAD – Daily Timeframe with Volume
Aggressive traders will often enter a long position after a break and close above the neckline resistance level and place a target higher up that is equal to the height of the rounded bottom.
Conservative traders, on the other hand, tend to wait for a break and close above the neckline, followed by a pull-back and retest of the neckline before they will enter.
Just take note that the conservative entry method might not always work out and result in a trader missing a setup if price just continues higher. A stop loss can generally be placed a few pips below a swing low that occurred before the breakout.
Traders Tip: Keep an eye on how volume behaves during this pattern formation because the volume will often have an inverse relation to what price is doing by either dropping and then rising before the pattern completes or instead decline as price moves lower.
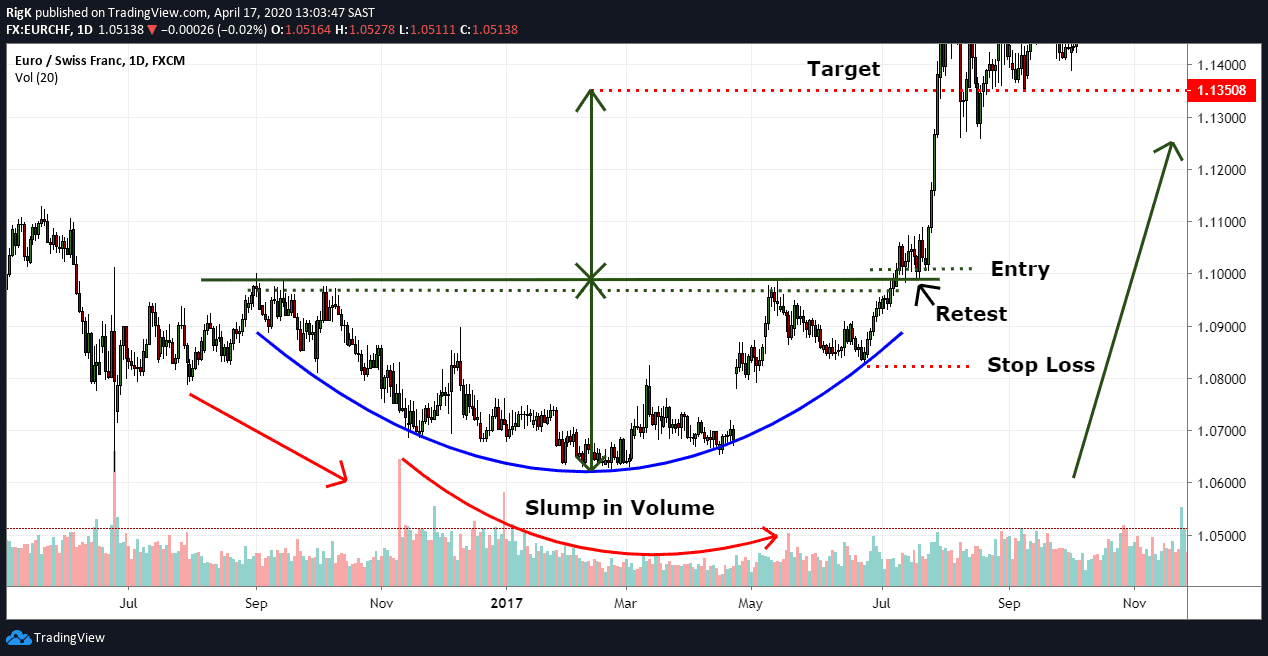
Image 4: EUR/CHF – Daily Timeframe with Volume
My final chart shows the same long-term rounded bottom pattern that occurred in the EUR/CHF. Note how both aggressive and conservative entry methods would have worked in both the NZD/CAD and EUR/CHF setups.
In this example, the volume also experienced a huge slump during the chart pattern formation, even when price bottomed the volume stayed low which was an early indication that the selling pressure was drying up and that a turn higher was highly probable.
Rounding bottom patterns indicate that a trend reversal to the upside is highly likely, especially when volume behaves as it did during the examples shown above. The next time you encounter this pattern, be careful if you are holding a short position or prepare to get long once the pattern ends.
YOUR CAPITAL IS AT RISK
PEOPLE WHO READ THIS ALSO VIEWED: