Panic and over-enthusiasm can be contagious and are why stock market prices don’t go up in a straight line. That means using the Fear and Greed index can help traders optimise returns by identifying when might be a good time to buy at the bottom, sell at the top, or take action somewhere in between those two extremes. Let’s explore this further.
What Is The Fear And Greed Index?
The Fear and Greed Index was created by CNNMoney to measure market sentiment. It converts seven different variables into one number, which is reported as being between 0-100. A reading of 50 is deemed neutral. One below 50 indicates fear is the major influence on prices, and when the Fear and Greed Index is above 50, greed and over-optimism are in command of price behaviour.
The index can therefore be used to ascertain if the stock market is currently over or under priced. This is based on the premise that at some point, investor sentiment will change, and stock prices will follow that shift in mood.
The Fear and Greed Index doesn’t incorporate indicators that could help traders identify if sentiment is building or waning. A period in time when the index moves from 52 to 54 would suggest greed is building momentum. However, the index doesn’t predict whether that trend will continue or reverse – a decision on when that might happen is left up to individual traders.
How Is The Fear And Greed Index Calculated
Each of the seven different technical indicators that are used to calculate the Fear And Greed Index measure a particular aspect of stock market behaviour. These relate to market momentum, stock price strength, stock price breadth, put and call options trading activity, demand for junk bonds, market volatility, and safe haven demand.
There is a benefit in understanding the nature of the seven different metrics. Depending on market conditions and the type of strategy being applied, each could also be used in their own right.
- Market Momentum: Compares the current price of the S&P 500 to the rolling average of the previous 125 days, the 125-day Simple Moving Average (SMA).
- Stock Price Strength: Large-cap firms can have a considerable influence on a stock index. To get around the problem of big firms skewing readings on overall market mood, the stock price strength metriccalculates the number of stocks on the New York Stock Exchange hitting new 52-week highs and compares it to the number hitting 52-week lows. This reduces the risk of price moves in single stocks with large market capitalisations moving an index in one direction when a greater total number of stocks are moving in the other direction.
- Stock Price Breadth: This is another metric which aims to help traders look past the performance of dominant large-cap stocks and establish the mood of the wider market. It calculates the daily trading volumes in stocks listed on the New York Stock Exchange and compares the number of stocks which are rising against the number which are falling.
- Junk Bond Demand: Gauges risk appetite by measuring the yields on different kinds of bonds. Investment-grade bonds such as AAA-rated corporate bonds, US Treasuries, and UK gilts have higher credit ratings than Junk bonds. This is because bond investors demand a greater financial reward for buying bonds issued by parties that have a greater chance of default. Measuring the spread between high-quality bonds and Junk bonds offers an insight into risk appetite in the bond market. A relative increase in demand for Junk bonds tightens the spread and points to there being more greed in the market.
- Put and Call Options: Measures trading activity in put options and call options. When the ratio of puts being bought is rising, it is usually a sign of investors getting nervous and using options to hedge downside risk, which signifies increased fear.
- Market Volatility: The Fear and Greed Index includes data relating toCBOE’s Volatility Index (VIX). The VIX records buying activity in the options markets and can be used to gauge if traders expect stock market price volatility to increase or decrease in the next 30 days. A higher VIX reading suggests fear is the dominant theme in the markets and a lower reading points to bullish sentiment being the main price driver.
- Safe Haven Demand: Stocks are typically regarded as riskier than bonds and this metric measures the difference between returns on stocks and US treasuries. It tracks the relative performance of both asset groups over the previous 20 trading sessions.
The seven metrics are assigned their own greed or fear number, again ranging from 0–100. This is based on how far the price in each market has diverged from a long-term average. The greater the divergence, the stronger the reading and the further that indicator’s number will be from 50.
Each indicator receives equal weighting when they are incorporated into the single number for the overall Fear and Greed Index, which therefore offers an averaged out reading of market sentiment. Pricing updates are carried out on a real-time basis, so as and when each of the seven metrics is updated the overall index score will be adjusted accordingly.
How To Trade Using The Fear And Greed Index
The Fear and Greed Index can be incorporated into trading decisions in two ways. The first relies on spotting a trend and using a momentum strategy to trade in the same direction of it. The alternative approach is to use fundamental analysis to identify over or undervalued stocks that will experience a price change once the disconnect between market mood and stock prices is corrected.
Market selection also plays a part. Some assets, such as high-beta stocks, are more sensitive to greed and fear and, as a result, overshoot to a greater extent than defensive stocks, which tend to have lower price volatility.
Those running short-term speculative strategies may target the more volatile markets so that profits are made within a shorter time frame. Though, of course, there is a risk that losses occur equally as quickly.
During a period when fear is the dominant force, long-term buy-and-hold investors may use the index to help them come to terms with recent losses. If the market is in panic mode, that doesn’t necessarily mean well-thought-out investment decisions need to be abandoned, and a low index reading could even act as a trigger to add to positions.
A quick look through the readings for the index adds some context to the question of how to trade using the Fear and Greed Index. On 9th November 2021, the index recorded an ‘Extreme Greed’ reading of 77. On that day, the S&P 500 index was priced at 4,677, but six months later, the index was trading at 4,005, which represented a 14.38% fall in value.
S&P 500 Index – Daily Price Chart – 2021 – 2022 – Fear And Greed Index Reports Extreme Greed
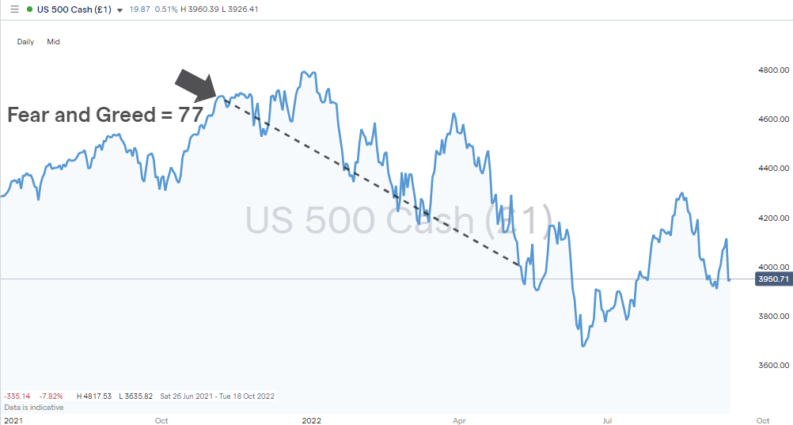
Source: IG
On 11th May 2022, the Fear and Greed Index reached a year-to-date low of 4. The S&P 500 index was on that day priced at 3,943 and just three months later had rebounded to 4,4278, an almost 8% return for any traders who bought the S&P 500 at the Fear and Greed Index low.
S&P 500 Index – Daily Price Chart – 2021 – 2022 – Fear And Greed Index Reports Extreme Fear
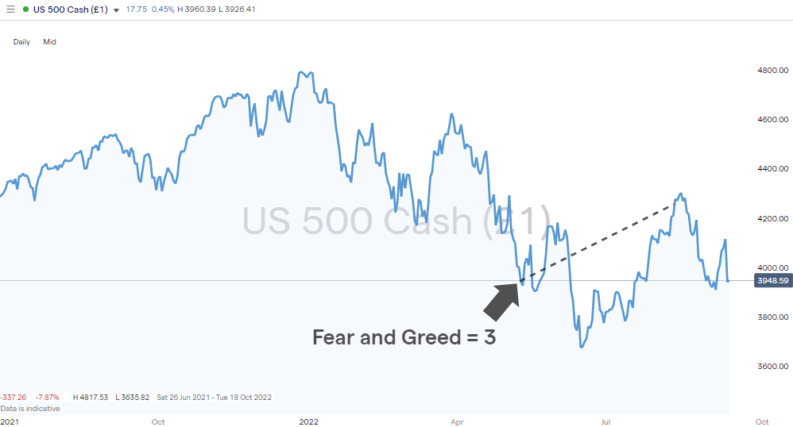
Source: IG
The keen-eyed will note that in both instances, while the trade ended up being profitable, there was a time lag between the extreme Fear and Greed reading and the price of the S&P 500 index responding. In both cases, the price of the stock index continued to overshoot, which would have resulted in losses being initially incurred. The question traders have to ask is how and where to set stop-loss instructions so that the position isn’t closed out before it becomes profitable.
Advantages Of Using The Fear And Greed Index
There’s no getting away from the fact that having a simple numerical measure of market sentiment is a handy tool for traders to have. The Fear and Greed Index also updates in real-time, so it’s possible to see how it is moving on different timescales.
The popularity of the index is another reason for investors to factor it into the decision-making process. Trading with the trend, and not against it, is a fundamental part of successful investing. That can be made more likely by identifying and using any key metrics which many other traders watch.
Another plus point of the Fear and Greed Index is that it can be applied to a wide range of trading strategies. Whether you’re using fundamental analysis to establish if a stock is incorrectly priced, or technical analysis to manage momentum-based strategies and engage in scalping, the index offers a straightforward reading of market mood.
Disadvantages Of Using The Fear And Greed Index
The Fear and Greed Index shares the same core challenge as other technical indicators, that it is backward looking. The data points that feed into the seven constituent parts of the index are all based on historical information. They tell you where the market has been, but not necessarily where it is heading.
There is also a risk that using the index can result in ‘overtrading’. While the idea of finessing positions and trading in and out of positions is appealing, a lot of seasoned pros would suggest it is harder to do than it looks. For buy-and-hold investors in particular, putting an emphasis on the ‘hold’ element of their strategy should, in the long-term, result in improved returns.
From a technical perspective, there is the question of whether each of the seven metrics being equally weighted results in the overall number being as useful as it could be. Different traders running different strategies may want to give more focus to one of the seven indicators than the others.
VIX Volatility Index – Daily Price Chart – 2021 – 2022
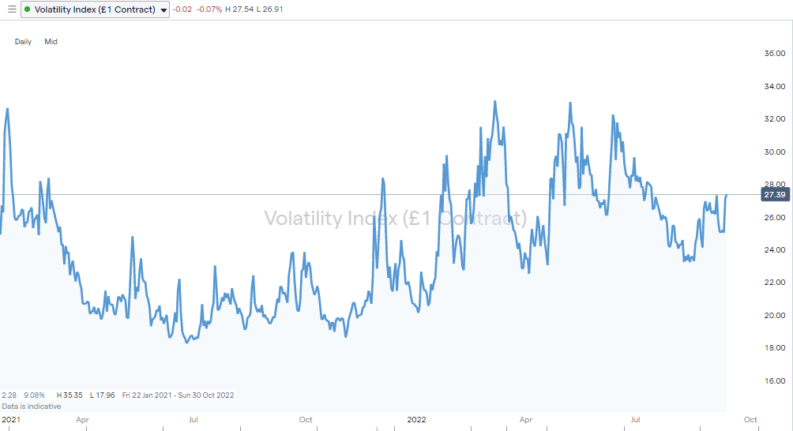
Source: IG
The ‘Market Volatility’ element of the Fear and Greed index uses data from the CBOE Volatility Index (VIX), which reports trade activity in the options markets. The VIX has been operating for longer than the Fear and Greed Index and also measures market confidence – hence it picking up the unofficial title of the ‘Fear Index’. The VIX already carries out a highly specialised approach towards measuring sentiment and like the Fear and Greed Index is closely followed by market participants. It could be argued that adding six other elements to create an averaged-out reading diminishes the likelihood of the VIX’s crucial role being recognised.
The VIX index also has the advantage of being able to be traded in its own right, with several trusted brokers offering a market in it. The Fear and Greed Index offers an insight into market conditions and gives a pointer towards the health of the stock market, but the VIX, in contrast, offers a direct route to trading decisions based on whether optimism or pessimism are currently being overplayed.
Final Thoughts
Whether you are an experienced investor or an absolute beginner, the Fear and Greed Index is a useful tool but basing trading decisions solely on it might not be the best approach. While the reading it gives is a neat summary of market sentiment, the alternative view is that it oversimplifies a complex situation. Nor does it offer few clues about whether, or when, mood might shift. At some point, investor sentiment will swing back in the other direction, and stock prices will move to reflect that change, but timing is everything.
Thanks largely to its high profile, the index does have a role to play. The simplicity of the methodology and single number output means it is often cited in reports and analysis. It’s a number a lot of people follow, and its role in spotting trading signals shouldn’t be downplayed, but it works best when used in conjunction with other indicators.


