Whether you’re approaching a bear market as someone determined to ride it out, or pick up the bargain of a lifetime, understanding how they work is crucial to your strategy going to plan. In this article, we’ll consider how to identify a bear market, how to trade them, and when the next one might be.
What Is a Bear Market?
The definition of a bear market is when price falls by 20% or more from previous highs. They can occur in any asset group, including forex, commodities, crypto and bonds, but the phrase is most frequently applied to the stock markets.
Bear markets can take the form of a short-term price crash brought on by a shock news event. These cyclical bear markets, such as the one that followed the outbreak of COVID-19, can last as little as a few weeks. Alternatively, they can be long term in nature and extend for months and years. In these bear markets, investors risk experiencing ‘a death by a thousand cuts’ due to structural weakness in the global economy or a particular sector or it.
Nasdaq 100 Index Bear Market of March 2020 – COVID-19 Sends the Markets Crashing
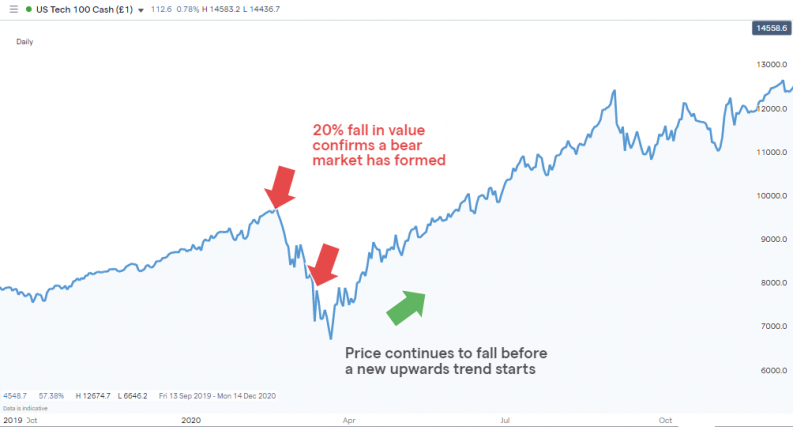
Source: IG
It’s also worth noting that the phrase ‘bear market’ is often used to reflect market mood. There could be instances where a stock index has fallen in value by 10% rather than 20%, and while this represents a market ‘correction’ rather than a bear market, it’s still likely that commentators and investors describe the market mood as bearish.
The definition can be used rather loosely, and getting too caught up in the 20% price move can be counterproductive as the priority is to read the market mood. Spotting trends early is always a good idea, and when the term bear market is being used extensively, it’s a sign that not only have prices fallen, but also that many are expecting them to continue doing so.
How to Spot a Bear Market
Part of the reason why equity markets are often associated with the term bear market is that historical data points to stocks showing a tendency to rise in value for extended periods of time, with infrequent intervals along the way when panic sets in and prices crash.
Longer-term bear markets, due to a structural mismatch between supply and demand for an asset, can also result in bear markets. These are typically found in sectors such as forex or the commodity markets. Producers of oil or copper, for example, can take years to rein in oversupply of their product following an overnight reduction in demand.
Bear market price charts will also be associated with short-lived rallies in price, but the overriding trend will be of lower highs and lower lows.
How Long Do Bear Markets Last?
The parameters used to measure a bear market are basic. They involve measuring price over time. This means that as long as the 20% price drop occurs at some point, there’s no constraint on how long it takes to achieve that ‘target’. This is an important factor to consider as the ways of trading a bear market will depend on whether it’s cyclical and likely to last weeks, or long term and potentially going to run for months or years.
Investors with existing positions and traders approaching the market fresh might take different approaches – the former group faced with the decision of whether to cut their losses and the latter looking to buy the dip or alternatively trade with the bearish trend by selling short.
Equity Bear Markets Through History
18th February 2020-20th March 2020 – A short-term cyclical bear market that lasted just under one month. Caused by the outbreak of COVID-19 and fears about long-term damage to the global economy. In the space of a few weeks, the S&P 500 index gave up 35% of its value.
S&P 500 Index Bear Market – February 2020
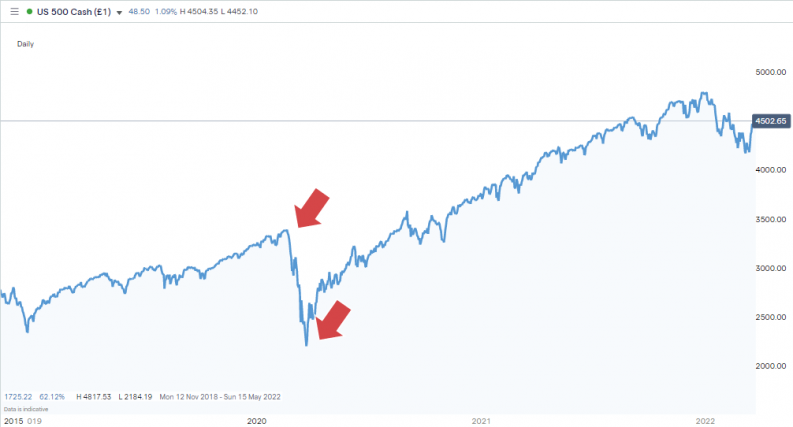
Source: IG
October 2007-March 2009 – A longer-term bear market that marked the Great Recession and was caused by structural weaknesses in the global financial system. Investor confidence was shaken for 18 months as efforts to rectify inherent instability took time to come to fruition. The S&P 500 index recorded the biggest fall in its history and gave up 57% of its value.
March 2000-October 2002 – Another long-term bear market that followed the dot-com boom. The market conditions in the run-up to this crash were at one point described as “irrational exuberance” by US Federal Reserve chair Alan Greenspan (source: Federal Reserve).
S&P 500 Index Bear Market – October 2001 to March 2009 – The Great Recession
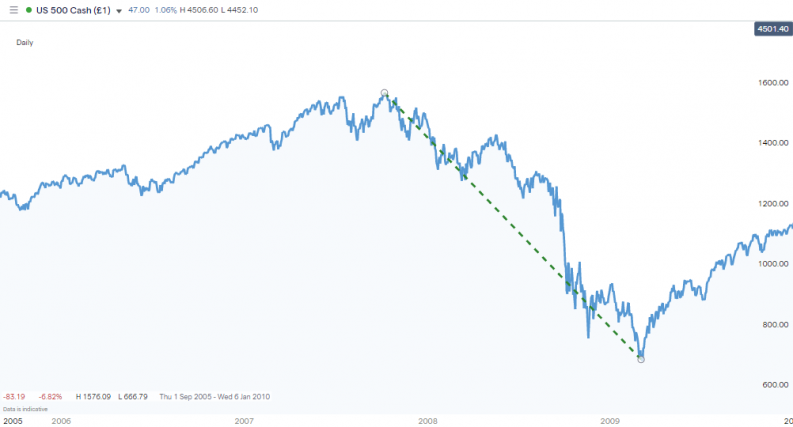
Source: IG
Why Do Bear Markets End?
Each of the above bear markets ultimately came to an end and were followed by long-term bull markets, which saw prices rise to new all-time highs. There are plenty of ways of anticipating when a trend will end, but unfortunately there are few hard and fast rules about which one might apply to a particular market situation.
March 2020 – Investors who took the view that it was just a matter of time for a COVID-19 vaccine to be developed began to buy back into stocks at discounted price levels. Their approach was helped by tech stocks such as Zoom and Netflix benefiting from the move to online work and leisure activities. These COVID-19 ‘winners’ led the rebound, and between March 2020 and December 2021, the Nasdaq 100 index rose 145% in value.
Nasdaq 100 Index – February 2020 – Bear Market Turns Bullish
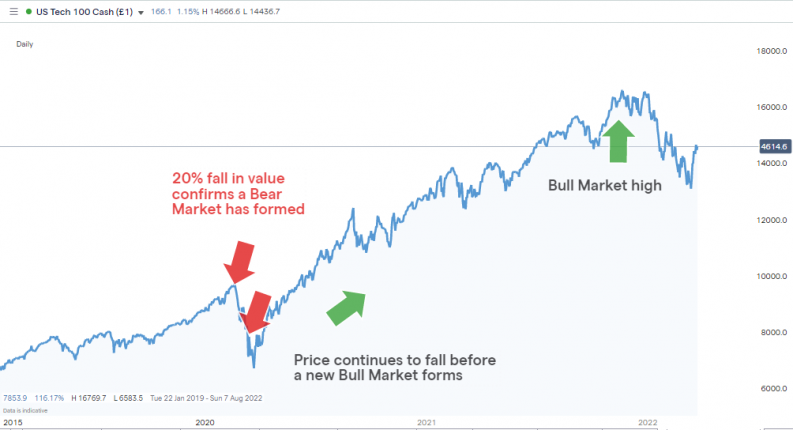
Source: IG
March 2009 – A decade of cheap and easily accessible mortgages created a housing bubble that simply burst when house prices began to soften, and a cascade of defaults broke the financial system. Investor fears finally abated when the ‘whatever it takes’ approach of Mario Draghi, the then head of the European Central Bank, signalled an end to fears that more banks would go bust.
October 2002 – Investor confidence finally returned when tech stock prices subsided to be in line with traditional valuation models. From a technical analysis perspective, the rebound came after a period of price consolidation and a textbook triple-bottom price pattern, as demonstrated by the red-amber-green arrows in the below chart.
S&P 500 Index Bear Market – October 2001 to March 2009 – The Great Recession
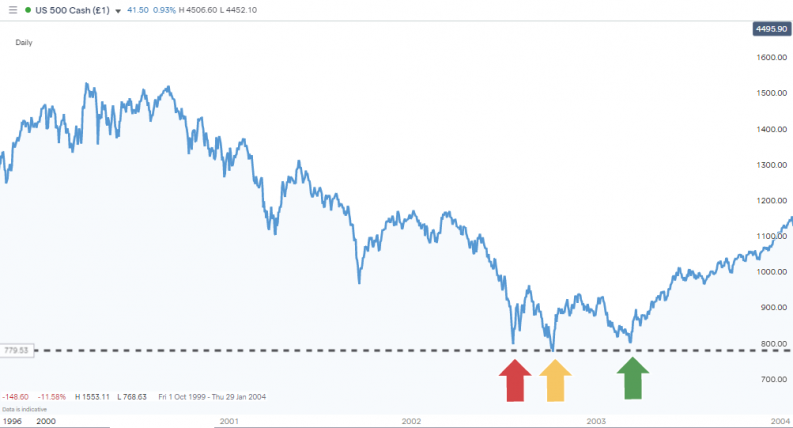
Source: IG
The Best Strategies for Trading a Bear Market
Strategies for trading a bear market are greatly influenced by your starting position. If you have a well-established equity portfolio designed to generate long-term returns, then you might take the view that you’re willing to ride out the price correction.
One way for these kinds of investors to react is to use options to hedge their portfolio. An alternative would be lightening positions in some high-beta stocks for risk management purposes or in the hope of buying them back at a lower price if the crash continues.
If you’re approaching the markets with a clean slate, then there is greater flexibility regarding strategy choice. Traders and investors who feel that they missed out on a previous bull market might see the price adjustment as a pullback and a chance to finally buy in. Others who felt that the downward adjustment was completely justified and could continue might look to sell short.
Whichever strategy you are using to trade the bear market, the below tried-and-tested approaches can help you optimise your trade entry and exit points.
Bear Market Trading Strategy 1 – Averaging Into Positions
Fierce competition in the online broker sector has resulted in cost no longer being a barrier to entry. Whether you’re trading indices, commodities or forex, the difference between buying and selling price – the bid-offer spread – can be expected to be super-tight. If it’s not, then head to this list of trusted brokers that have been reviewed by the AskTraders team and confirmed as being reliable and offering attractive T&Cs.
Low-cost trading is always a nice-to-have feature as it helps the trading bottom line. Commission-free trading can also help you adopt an approach of building into positions over time and averaging out your trade entry price. This applies to buy-and-hold positions and short-selling using CFDs.
If you’re looking to specialise in trading single stocks such as Apple, Tesla or Google (Alphabet), then search for good brokers such as eToro and IG that invariably don’t charge commissions on equity trades. Instead, they make their revenue on the bid-offer spread, so there aren’t one-off fees each time you buy or sell during a bear market.
Online platforms allow for cost-effective trading even if you have a small total amount of cash available. It opens the door to buying or selling in small increments and this averages out your trade entry point over time. This can be done whether you are bearish and are selling short, or bullish and building into long positions.
Bear Market Trading Strategy 2 – Trendlines
Price charts can be used to identify trendline-based trading strategies. In equity markets, the long-term path of least resistance is upward, but moments when price breaks through key support levels can signal the beginning of a bear market.
Nasdaq 100 Index – Trendline Trading Strategy
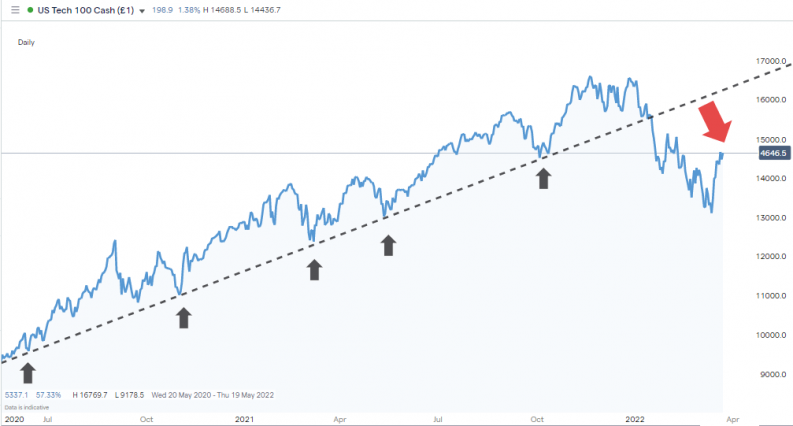
Source: IG
Between June 2020 and January 2022, the Nasdaq 100 index maintained upward momentum and bounced off a supporting trendline on more than five different occasions. The moment when it finally broke through that line led to further selling pressure and the formation of a bear market with the peak to trough fall in the value of the index being greater than 20%.
Bear Market Trading Strategy 3 – Momentum Indicators
Momentum trading is based on the premise that once prices head in one direction, they will invariably continue to move in the same direction for the foreseeable future. Price charts such as the above trendline strategy can offer a clue to a downward trend forming, but other technical indicators are provided free of charge by high-quality brokers. These can be used to double-check how strong momentum is and include:
- RSI (Relative Strength Index)– By processing price data through a clever formula, the RSI identifies if momentum in a market is likely to hold, build or decline. It can be applied to different timeframes, so you can identify if a market is overbought or oversold on an hourly, daily or monthly basis.
- Heikin-Ashi Candlesticks– This strategy allows traders to monitor momentum using specially designed candlestick charts that have been customised to filter out market ‘noise’. The shape and colour of the candle give an indication of whether a downward trend is set to continue or reverse.
S&P 500 Index – One-Hour Candles – Heikin-Ashi Momentum Trading Strategy
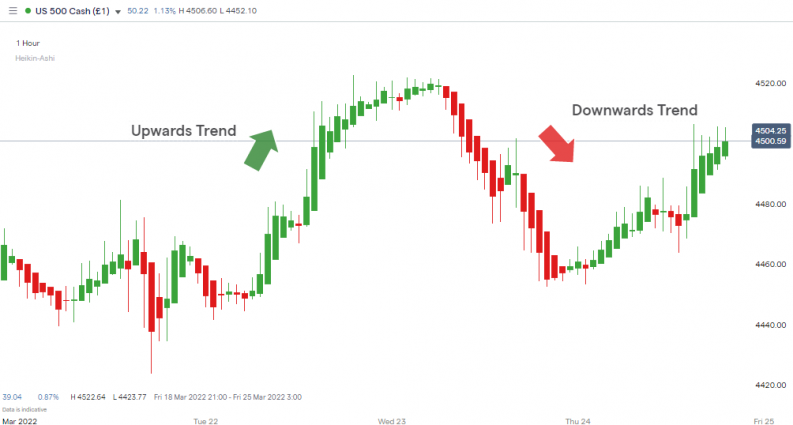
Source: IG
When Was the Last Bear Market?
A massive market sell-off in Q1 2022 resulted in a +20% correction in price – which confirmed Q1 2022 as the time of the most recent bear market.
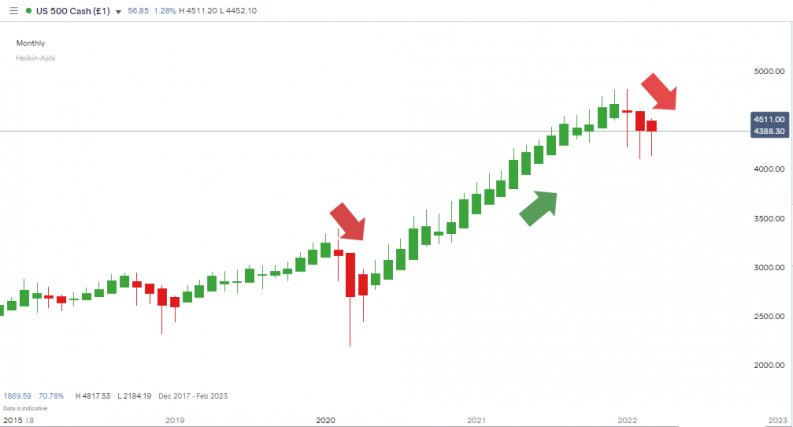
As of 24th March 2022 (the time of writing), the monthly Heikin-Ashi candlestick chart was still posting red candles, which is one of several signs that the bear market is still in motion, so some will still be looking to take advantage of the downward move by analysing how to trade a market sell-off.
S&P 500 Index – One-Month Candles – Heikin-Ashi Momentum Trading Strategy
Source: IG
How to Trade the Next Bear Market
If your view is that underlying market sentiment will ultimately return to being bullish and you’re looking for a bargain, then some of the exciting sectors to invest in can be found in this review of the best renewable energy stocks. Other areas of interest might be these biotech penny stocks or these EV stocks, which are an alternative to Tesla.
If you think that the bear market is likely to continue and you’re looking to sell short, then one word of caution is that losses on short positions are theoretically unlimited. Buy a stock and if it goes to zero, you lose your initial stake, but sell a stock and it can potentially keep on rising.
Final Thoughts
Reports in the financial press about bear markets can be full of concern, but that’s because they largely target an audience made up of investors who have established portfolios. For beginners, the increased volatility is a trading opportunity whether that involves short-term speculation or taking advantage of a dip in price to finally get into the markets.
The tools required to run technical and fundamental analysis on bear markets are freely available at good online brokers. Navigate to one of these trusted brokers featured in our articles and reviews and you’ll find it easy to make a call on your next trading decision. Setting up an account and putting on your first trades to take advantage of a bear market is a process that takes a matter of minutes to complete.


