Natural gas is one of the most important energy sources in the world. It’s used to fuel commercial and domestic economic activity, and to power electricity-generating powpricer stations. It ticks all the boxes associated with carbon-based fuels. It is transportable, storable, and available on demand.
It is also relatively cheap and, as carbon fuels go, is one of the cleanest. With the global economy transitioning towards cleaner energy, natural gas looks to be one of the obvious choices to ensure that carbon footprints become smaller, while at the same time, the lights are literally kept on.
Given its position in the economy, there is a lot of interest in forecasting the natural gas market. The core trading activity revolves around multinational firms and governments using gas to power their operations, but speculators can also find opportunities to profit from the ups and downs in the market.
YOUR CAPITAL IS AT RISK
What Is Natural Gas?
Natural gas is a hydrocarbon gas mixture that is mostly methane. It is also considered a greenhouse gas, which creates carbon dioxide during oxidation. Natural gas is a clean-burning fossil fuel that is used throughout the globe. It is used as a thermal energy source to heat homes, to cook food, and to generate electricity.
It is also used to fuel cars, buses and trucks via compressed natural gas and liquefied natural gas. Nearly all vehicles that use natural gas as fuel are in government and private vehicle fleets, according to the Energy Information Administration (EIA), which offers the following breakdown on how natural gas is used in the US.
- Electricity – 35%
- Industrial – 33%
- Residential – 17%
- Commercial – 12%
- Transportation – 3%
Most of the impurities that are found in natural gas need to be removed before it can be used as a fuel. This includes by-products of the processing operations, including ethane, propane, butanes, carbon dioxide, water vapor, and sometimes helium and nitrogen.
As it is a gas, most of its movement is through pipelines. To ship natural gas overseas, it needs to be turned into a liquid known as liquified natural gas (LNG). The US has the largest active natural gas financial market and has a vast pipeline system that crosses north into Canada and south into Mexico.
Natural Gas Demand and Supply
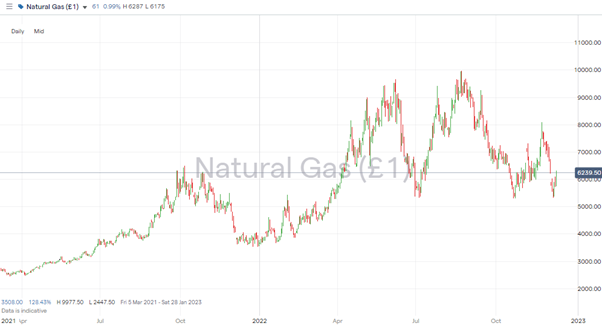
The demand for natural gas will fluctuate based on weather and economic industrial output. During periods of economic contraction, natural gas demand will usually decline. For example, during 2020 and the COVID-19 pandemic, the total consumption of natural gas fell by 4%. Other factors that can influence demand include changes to weather patterns.
In terms of supply, the world has proven reserves equivalent to approximately 52 times its annual consumption. This means that there are about 52 years of gas left – at current consumption levels and excluding unproven reserves. The countries with the top 10 largest-known (MMMcf) gas reserves are listed below and include several countries whose international relations are possibly best described as ‘complicated’:
- Russia – 1,688,228,000 – 24.3%
- Iran – 1,201,382,000 – 17.3%
- Qatar – 871,585,000 – 12.5%
- US – 368,704,000 – 5.3%
- Saudi Arabia – 294,205,000 – 4.2%
- Turkmenistan – 265,000,000 – 3.8%
- UAE – 215,098,000 – 3.1%
- Venezuela – 197,087,000 – 2.8%
- Nigeria – 180,490,000 – 2.6%
- China – 163,959,000 – 2.4%
How to Measure the Forecast Demand and Supply of Natural Gas
One of the best ways to measure the forecast of demand and supply is to evaluate the inventory levels that are estimated by the US Department of Energy and the EIA.
Each week, the EIA measures the inventory levels of natural gas that are held in storage facilities around the US. It provides a chart of historical inventory levels, which includes the five-year average as well as the five-year average range (including both the high and the low during a specific period).
The period between November and March is the withdrawal season. During this period, natural gas consumption is larger than production, and natural gas stockpiles decline as natural gas is removed from storage. During the period April through October, natural gas demand is lighter than supply, which means that stockpiles usually rise.
When inventories are rising above the five-year average range with an upward trajectory, prices are generally declining. When inventories are falling below the five-year average range and have a downward-sloping trajectory, prices are generally trending higher.
How to Trade Natural Gas
There are several ways that natural gas is traded. Those who produce, store and supply natural gas to consumers trade natural gas physically. Gas is generally transported through pipelines or shipped in LPG form. For those looking to trade the market with an intention of making a purely financial gain, there are other options.
YOUR CAPITAL IS AT RISK
The natural gas futures market is the one that is closest to the underlying activity of industrial buyers and sellers. Exchanges such as the Chicago Mercantile Exchange (CME) have been set up to facilitate the trading of natural gas in commoditised units. They attract multinational corporations, big banks, hedge funds, and some retail investors.
Futures trading isn’t for everyone. Physical futures, for example, require participants to take physical delivery of the gas on expiry date if you forget to sell out of your position in time. It can also be relatively expensive in terms of transaction costs, and the high margin requirement is another barrier to entry.
Contract for difference (CFD) instruments are a more user-friendly way for smaller-scale investors to get exposure to the natural gas market. It involves brokers and their clients engaging in binding agreements to pay the difference on a trade in natural gas.
Natural gas can be traded as a commodity in CFD form. The price will be determined by that in an underlying market, probably using a live feed from the CME exchange. However, a CFD broker is able to offer its customers the option to trade in smaller size, sell short, or use leverage.
Exchange-traded funds (ETFs) are another way to trade and speculate on the direction of natural gas prices. These hold a basket of natural gas futures or stocks of firms connected to the sector. They are priced in real time, and investors can trade in and out of them whenever the market is open.
A tried-and-tested approach is to buy stocks in firms that are impacted by changes in the price of natural gas. These could be producers such as BP (LSE: BP) or service companies such as Natural Gas Pipeline Company of America (NYSE: NGPL), which offer a ‘picks and shovels’ approach to gaining exposure to the sector.
Increased interest in the market and the revolution in online trading have resulted in brokers setting up state-of-the-art CFD platforms, which allow clients to trade natural gas CFDs, ETFs and stocks in an easy and cost-effective manner.
They are known for having neat intuitive functionality and offering a range of powerful software tools to give their clients an edge. There are research tools that cover both technical and fundamental analysis and a range of other time-saving and risk-management features.
Natural Gas Trading Strategies
Whether you are trading futures contracts, CFDs, stocks or ETFs, you can apply a variety of trading strategies.
Fundamental analysis is a focus on supply and demand as well as macro factors that could impact the price of natural gas. For example, when economic growth expands, demand should rise, and vice versa. You also might consider focusing on inventories. As inventories decline relative to the five-year average, prices are likely to climb. When inventories rise relative to the five-year average, prices are likely to fall.
Additionally, several natural gas traders focus on weather patterns. Colder-than-normal or warmer-than-normal temperatures can drive the price of natural gas. Additionally, during the hurricane season, natural gas traders will often follow potential hurricanes that might hit the US and create supply disruptions.
Market data can also offer clues as to whether the price of gas is about to rise or fall. Sentiment analysis considers whether market participants are building or reducing positions. That can be taken as a guide, but there is potential for markets to overshoot, which means that in extreme circumstances, they are often used as contrarian indicators.
Another form of analysis is called technical analysis, which is the study of past price movements. This could include trend following, momentum analysis and mean reversion analysis. The natural gas market is well established and highly liquid, and with so many instruments available to trade it, any strategy you might use on another asset group can be applied to the natural gas market.
Final Thoughts
Energy markets can be risky to trade. Geopolitical risk levels and weather patterns can change in an instant, and given the crucial nature of natural gas in the economy, any restrictions to supply can be followed by dramatic price surges.
The move to cleaner fuels is another underlying trend to consider. The tricky thing for natural gas traders is that it is seen as the least bad of the carbon fuels, but remains in the hit list of purists lobbying for a faster shift to using renewables.
In terms of operational risk and convenience of trading, a trusted CFD broker is the best option for those looking to trade natural gas as a commodity. This does mean that some thought needs to be given to your choice of broker.
This list of trusted brokers includes firms that have been reviewed by the AskTraders team to ensure that they offer all the services needed to get your natural gas trading off to the best possible start.


