Picking the bottom of the market requires research and trading discipline and ensuring your approach ties in with your investment aims. It’s not for everyone, but as such opportunities don’t come around too often, when they do, the obvious question is when is a good time to buy, and ‘should I buy stocks during market uncertainty?’. Upgrading that proposition to ‘what stocks to buy now’ is the next step and the below five sectors are prime candidates for investment now.
S&P 500 Index Price Chart – 2021 – 2022 – Buy the dips?
Source: IG
 WELCOME BONUS - Free Share Bundle When You Invest £50!
Get up to £500 cashback for investing with IG.
WELCOME BONUS - Free Share Bundle When You Invest £50!
Get up to £500 cashback for investing with IG.
Stocks To Buy During Market Uncertainty
Not All Market Sell-Offs Are The Same
The unprecedented market sell-off of 2022 has caught many by surprise. Before the crash, some stocks were trading at unjustifiable price levels. Others with much better long-term prospects have been caught up in the dash to cash and now look undervalued. With the S&P 500 Index losing almost one-fifth of its value between January and May 2022, now could be time to step in and bag a bargain.
The H1 2022 market correction has been typified by consistent and relatively long-term selling pressure. It has been a painful process for any investor in existing positions and for any dip-buyers looking to step into the market who have learned that catching a falling knife is a bad idea. One notable feature of the 2022 correction is that it is very different to the previous crash of March 2020.
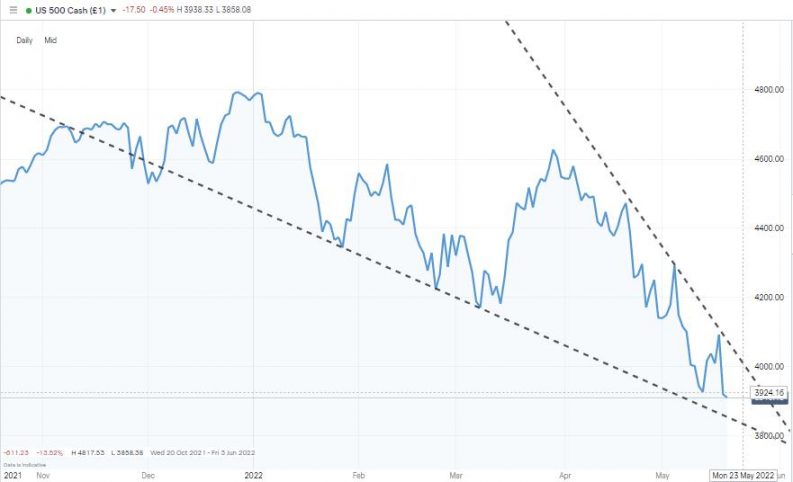
The arrows on the below price chart for the S&P 500 index mark the beginning and end of an 18.53% fall in value during the first half of 2022 that took place over 135 days.
S&P 500 Index Price Chart – 2021 – 2022 –135 days
Source: IG
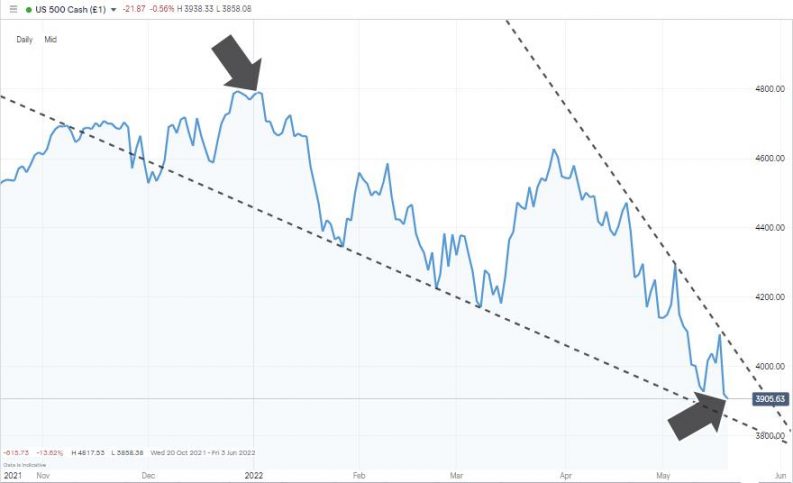
In comparison, the Covid-led market crash of March 2020 saw the S&P 500 fall in value by more than 35% in just 32 days. The two arrows on the price chart for 2020 highlight how using the same metric of 135 days after that sudden crash started, prices four and a half months later were a long way towards making a full recovery.
S&P 500 Index Price Chart – 2020 –135 days
Source: IG
It tells us two things. The first is that many of the big players in the 2022 market have, with some justification, been spooked by fears of inflation and interest rate rises. The second is that the rotation out of stocks has been relatively orderly. There have been few signs or reports of hedge funds liquidating positions to stay alive as there were in 2020. Instead, money has been draining from certain stocks. Establishing where that cash is going offers the best clue as to what to buy now.
Understanding the Nature of the Current Sell-Off
The price chart for the US Dollar Basket index shows that the first half of 2022 has been marked by increased demand for the US dollar. That is for two reasons; the liquidity that cash offers is always more attractive to investors during moments of market uncertainty. Secondly, the decision by the Federal Reserve FOMC on 4th May 2022 to hike US interest rates by 0.50% makes USD more attractive because US savings accounts now offer a better return.
USD Basket Index Price Chart – 2021 – 2022 –135 days
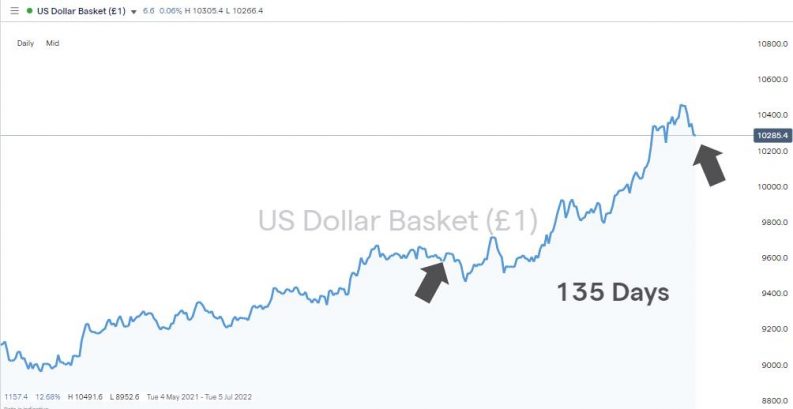
Source: IG
The cash currently sitting on the sidelines can be expected to flood back into the stock market once share prices have bottomed out. Equities have traditionally offered superior returns to cash, and institutional investors rely on generating alpha to stay in their jobs.
Buying any stock provides exposure to the benefits of a broad market uplift, but optimising returns requires fine-tuning that selection to those sectors which look best positioned to bounce. Technical and fundamental analysis point to the following sectors being ideal for moving into now. They cover a broad range of trading strategies and have been selected with one eye on the need to diversify capital allocation to smooth out returns and manage risk.
Bank Stocks
Concern over rising inflation and higher interest rates has been the main driver of the stock market crash of 2022. Banking stocks are impacted by those trends to a lesser extent than consumer-facing companies. Netflix stock is down 76.1% from its November 2021 highs due to the looming cost of living crisis and the ease with which users can cancel their subscriptions. Banking relationships are different, and higher interest rates can be good news for banks.
Due to close to zero interest rates, the spread between savings and lending rates has been squeezed for several years. Offering a negative rate on credit balances goes against the basic principles of capitalism and would have driven customers to hoard cash piles at home.
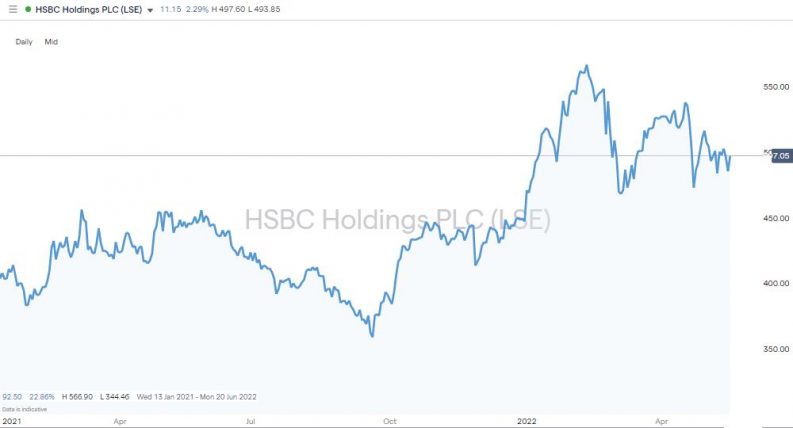
HSBC PLC Price Chart – 2021 – 2022
Source: IG
With rates heading upward, banks such as HSBC PLC will be able to improve its margins and revenue streams. The firm has a dividend yield of 3.59%, and its share price is currently trading 12.25% below where it was in February. That leaves room for capital gains and dividend income, and the broad market sell-off of 2022 is not down to a financial crisis as was the case in 2008.
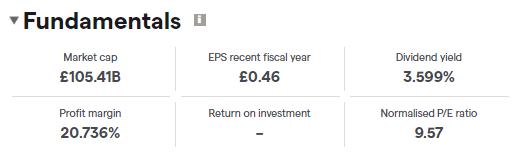
HSBC PLC – Fundamentals
Source: IG
High Yield Blue Chip Stocks
Large-cap firms with established business models and brand loyalty are a top pick for anyone buying into a market correction. They might be outshone by growth stocks during the boom years, but the yields on those stocks shoot up when they are purchased at rock-bottom prices.
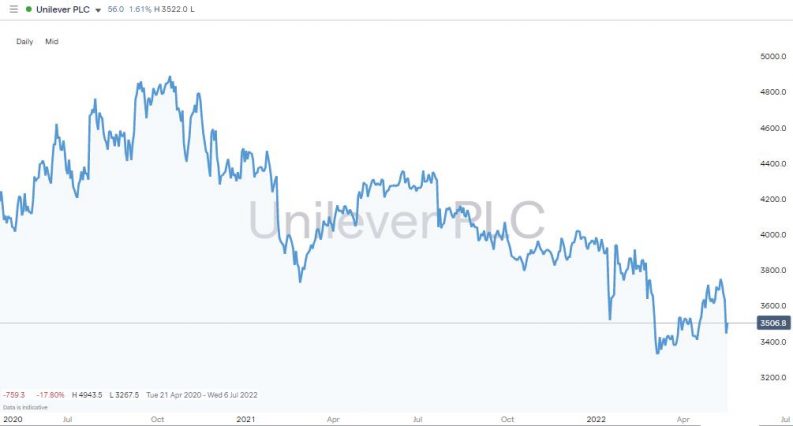
The cash payments in the form of dividends do fluctuate but not necessarily to the same extent as the share price, which means stocks such as Unilever PLC currently offer investors a dividend yield of 10.06%.
Unilever PLC Price Chart – 2021 – 2022
Source: IG
Unilever’s botched bid for GlaxoSmithKline points to a need for some kind of restructuring. The Unilever share price has fallen by almost one-third since October 2020, which suggests a lot of the bad news is already priced in. More positive interventions by the management team could act as a catalyst for upward share price movement. The suite of household staples the firm sells can be expected to show relative resistance to cutbacks on household spending.
Unilever PLC – Fundamentals
Source: IG
Defensive Stocks
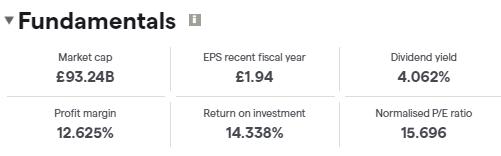
The flat-line nature of the share price chart for British American Tobacco might make it a name to miss when markets are surging; however, its stability is far more appealing when market conditions deteriorate.
Tobacco firms have fallen out of favour with institutional investors who have to apply ethical guidelines to their stock-picking activity. Still, retail investors can snap up a firm that makes products that remain in demand even during economic downturns.
British American Tobacco (BAT) Price Chart – 2018 – 2022
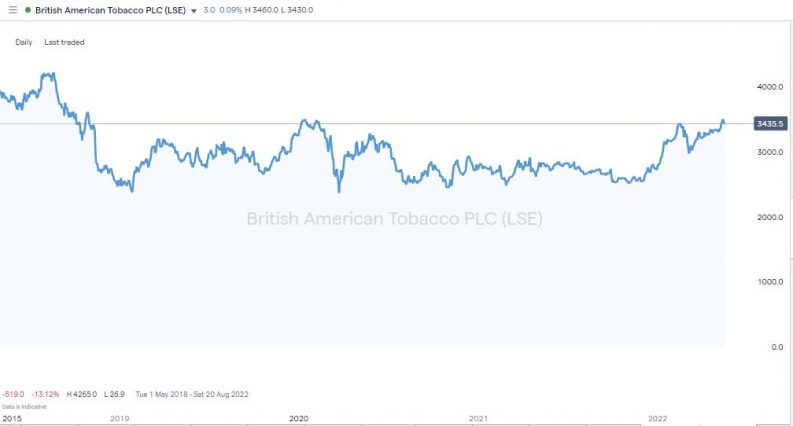
Source: IG
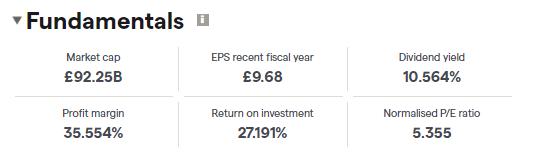
There is potential for capital gains, but the +10% dividend yield will be the main attraction for many investors. The P/E ratio of 10.7 is also well below the average for the FTSE 100 index, which is 14.5. That means that BAT sells products with low levels of demand elasticity, and the stock also looks undervalued compared to its peer group.
British American Tobacco (BAT) – Fundamentals
Source: IG
Commodity Stocks
Buying the stocks of firms in the commodity sector offers a convenient way to gain exposure to the underlying assets they mine and process. Equity transaction costs are typically lower than in the metals futures market, and stocks such as Rio Tinto pay regular dividends while futures don’t generate any passive income. In Rio’s case, the current dividend yield is a very attractive 10.36%.
A decision to buy Rio shares also offers a chance to capture the upside potential of the commodities supercycle. The firm is regarded as one of the best copper mining stocks to buy now and is a significant player in the iron ore and aluminium sectors. These materials will be in much demand as a new energy infrastructure is built across the globe to support the transition to a low-carbon economy.
Rio Tinto PLC Price Chart – 2018 – 2022
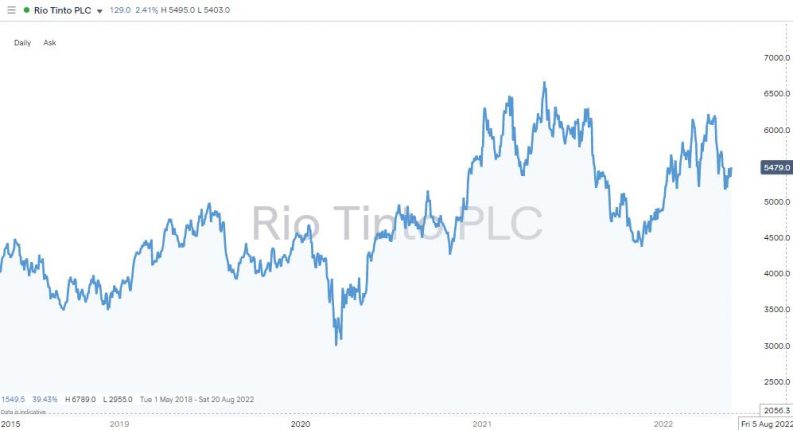
Source: IG
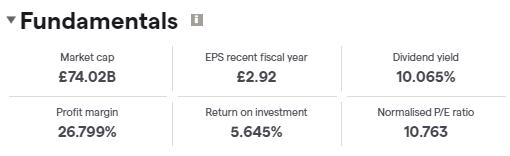
Rio is the second-largest metals and mining corporation in the world, with operations in 35 countries. During periods of market turbulence, that vast size and diversity in business operations offer a degree of security that smaller growth stocks do not.
Rio Tinto PLC – Fundamentals
Source: IG
High Beta Stocks
The four sectors already highlighted represent opportunities to buy into a falling stock market and maintain a balance between risk and return. High beta stocks are an altogether different proposition.
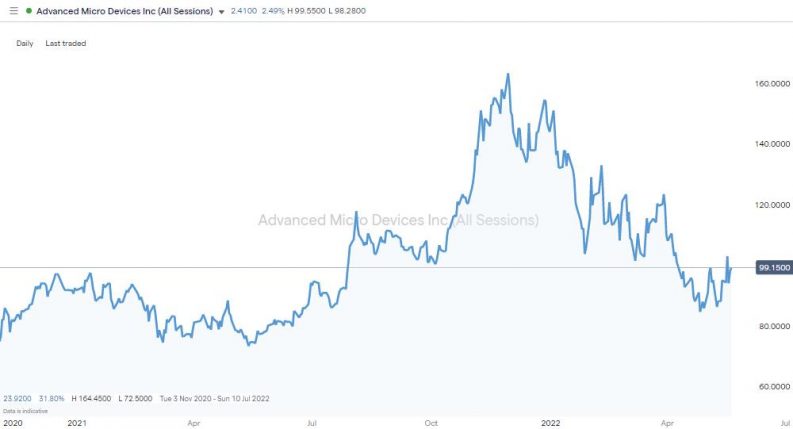
Stocks with price volatility greater than the average of an index overshoot to the upside and the downside. Advanced Micro Devices (AMD) is one example. Its stock price plummeted by 39.2% between November 2021 and May 2022. Over the same period, the Nasdaq 100 index gave up 25.28% of its value. AMD can be expected to rebound faster and harder than the sector average if and when the market rebounds, making it a prime candidate for those looking to buy the dip.
Advanced Micro Devices (AMD) Price Chart – 2018 – 2022
Source: IG
Timing your buy of AMD is crucial. The firm does not pay dividends but instead reinvests profits in projects designed to help it grow.
Final Thoughts
Any experienced trader will tell you that there’s no mistaking the savage price moves of a bear market. They might also add that your portfolio can come out on the other side in good shape by applying strategies designed to cope with a market sell-off. Market turbulence can be seen as an opportunity to buy good stocks which have been momentarily dragged down by bad ones, and these market gurus are bullish right now.
Whether you’re new to trading or have already developed your techniques for trading a market sell-off choosing the right broker can help you optimise your returns. This list of trusted brokers includes firms reviewed by the AskTraders team that have been verified as offering cost-effective and safe trading conditions.


