How many should you use? What are the best indicators to use, and how do you use them? In this technical indicators guide, we’ll be answering these questions and also taking a look at:
- Types of technical indicators
- The most popular ones
- Leading and Lagging indicators
- Top tips for using them
Ready? Let’s get started.
What Is a Technical Indicator?
Technical indicators are used traders to assess likely price movements. They help traders make informed trading decisions by identifying potential entry and exit points through analysing past trends and anticipating the future movement or direction of a market.
They are created using mathematical formulas based on previous prices, volume, and interest in an asset. These complex formulas are then displayed using a visual format on trading charts.
How Are Technical Indicators Used?
As mentioned above, technical indicators are a great tool when assessing future price movements, but they can also be used to assess:
- Volume
- Volatility
- Changes in trends
- Overbought or oversold assets
- Key price levels

Essential Terms To Know
Before we go into more detail, you’ll need to know the lingo. Some of the words you will need to know when reading about technical indicators are:
Support
A support level is a predetermined level, that when the price is moving lower, it will reverse from that level and move higher.
Resistance
Resistance is the opposite of support. When the price is moving higher, the predetermined resistance level will act as a level where the price will reach and reverse to start moving lower.
Consolidation
When prices are trading in a sideways pattern or bouncing between two price areas, this is known as consolidation or a sideways trend.
Chart Patterns
Chart patterns are recognisable shapes that occur on price charts. For example, if price touches a key level twice before reversing its trend, this is known as a double-top or double bottom chart pattern.
Trend
A trend is defined as when price continuously moves either up or down. An uptrend will make higher highs, while a downtrend will make lower lows.
Volatility
Volatility can be defined as an up and down market movement. If an asset drastically moves higher or lower in price, it will be calculated as a standard deviation from the expected price.
If an asset goes through remarkable changes in value, it would be considered highly volatile.
Simple Moving Average
There are two types of moving average. The first is the simple moving average which is a widely used technical indicator, that shows the average price over a defined period. It is shown as a line on your price chart.
Exponential Moving Average
The exponential moving average is similar to its simple counterpart, but it places more significance on more recent price data. It is also known as the exponential weighted moving average.
Advantages & Disadvantages
The advantages of technical indicators are:
- Can be applied to any financial instrument
- Can be applied to any timeframe
- Less data required for analysis
- Provides the ability to pinpoint entries and exits
The disadvantages are:
- Different indicators may provide different signals
- Can be difficult to trade using technical indicators in highly volatile markets
- Does not factor in economic data in the analysis
How Technical Indicators Work
Technical indicators work by trying to analyse different aspects of the market.
They will try to analyse market psychology by assessing different aspects of the market such as chart patterns, momentum or volatility to determine future trends.
Technical indicators do not take fundamental or macroeconomic analysis into account.

Now that we know what a technical indicator is and how and why they’re used, it’s time to take a look at some real-life examples.
Useful Pages:
Compare Stock Brokers | Compare Forex Brokers | Compare CFD Brokers
What Are the Different Type of Technical Indicators?
The four main types of technical indicators used by traders are:
- Trend
- Momentum
- Volume
- Volatility
Trend Indicators
Trend indicators attempt to analyse the direction and of a trend. Due to the nature of these indicators, they tend to lag behind price.
Trend Indicator Examples
These are some of the most popular Trend Indicators used by traders:
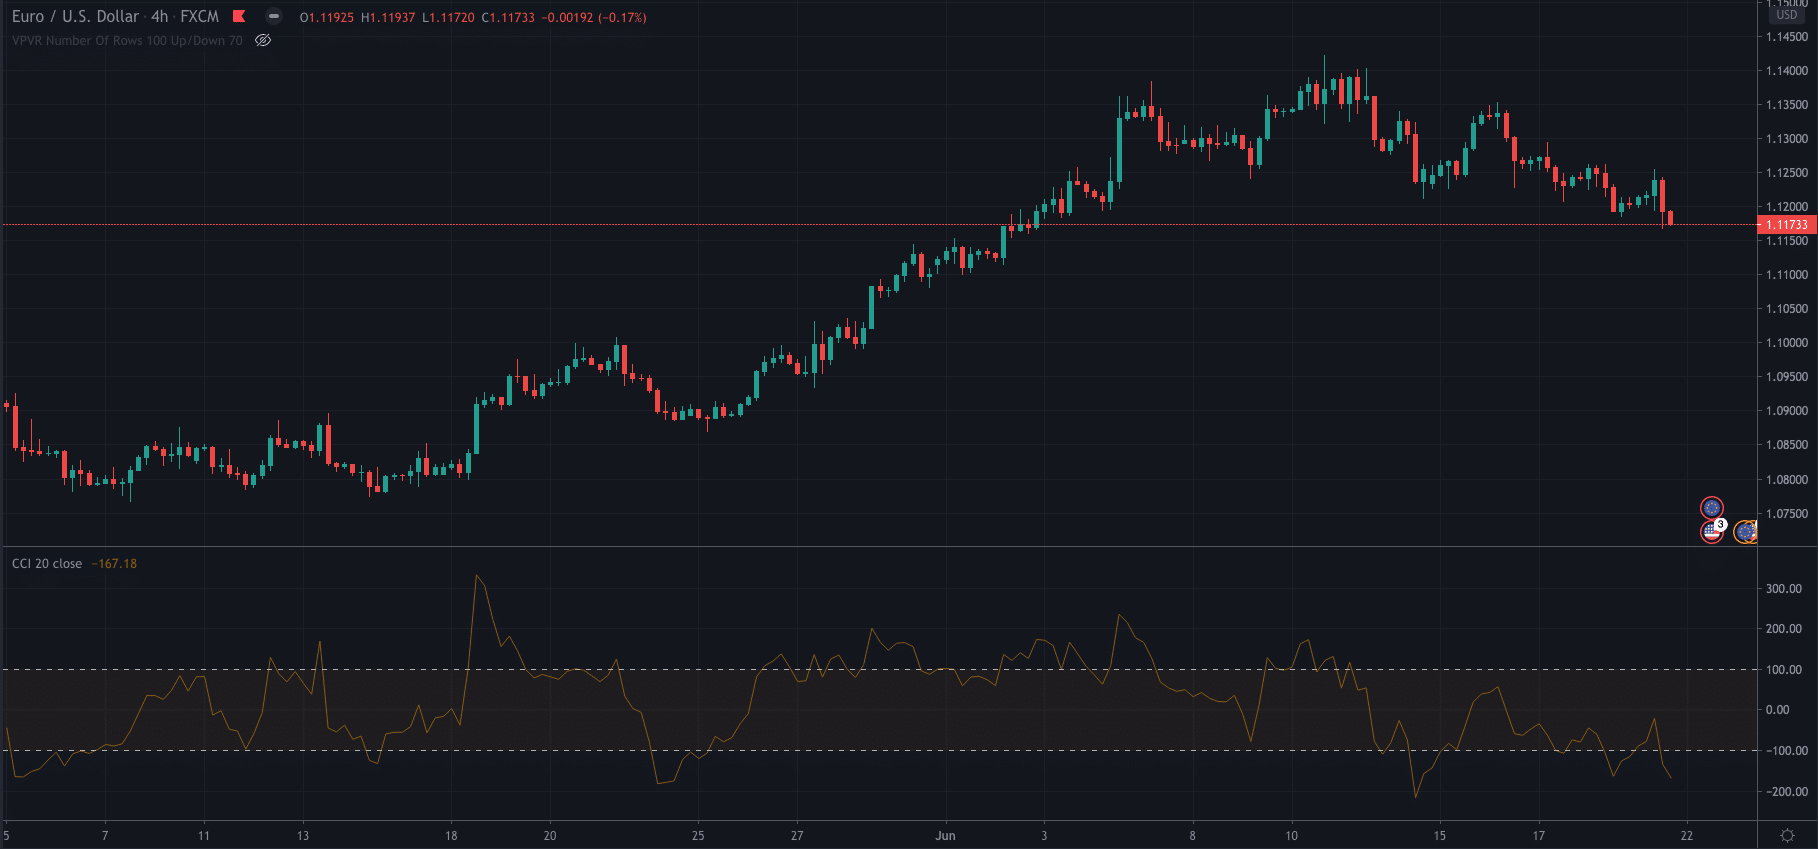
Commodity Channel Index (CCI)
The CCI measures the current price against the average price over a specified period.
So, when the current price is high compared to its average price over the period, then the CCI will move higher. The same applies if prices are lower than the average over that period, the CCI will move lower.
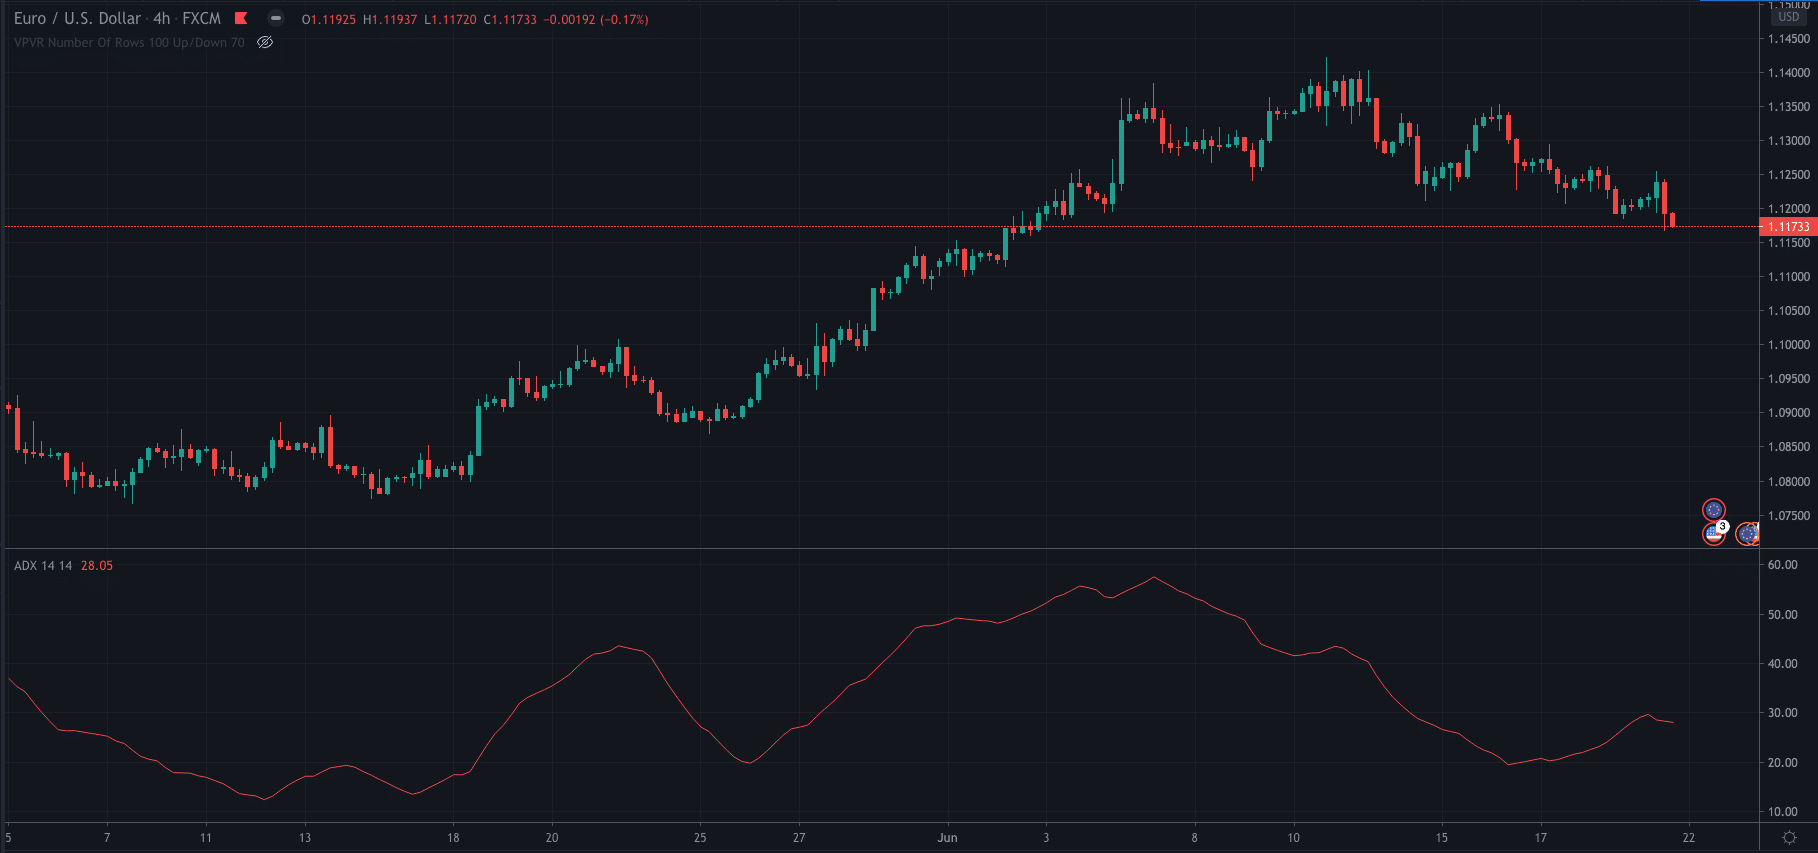
Average Directional Index (ADX)
The ADX indicator analyses the overall strength of a trend. It is calculated by using the averages of expanding price range values over a specified period.
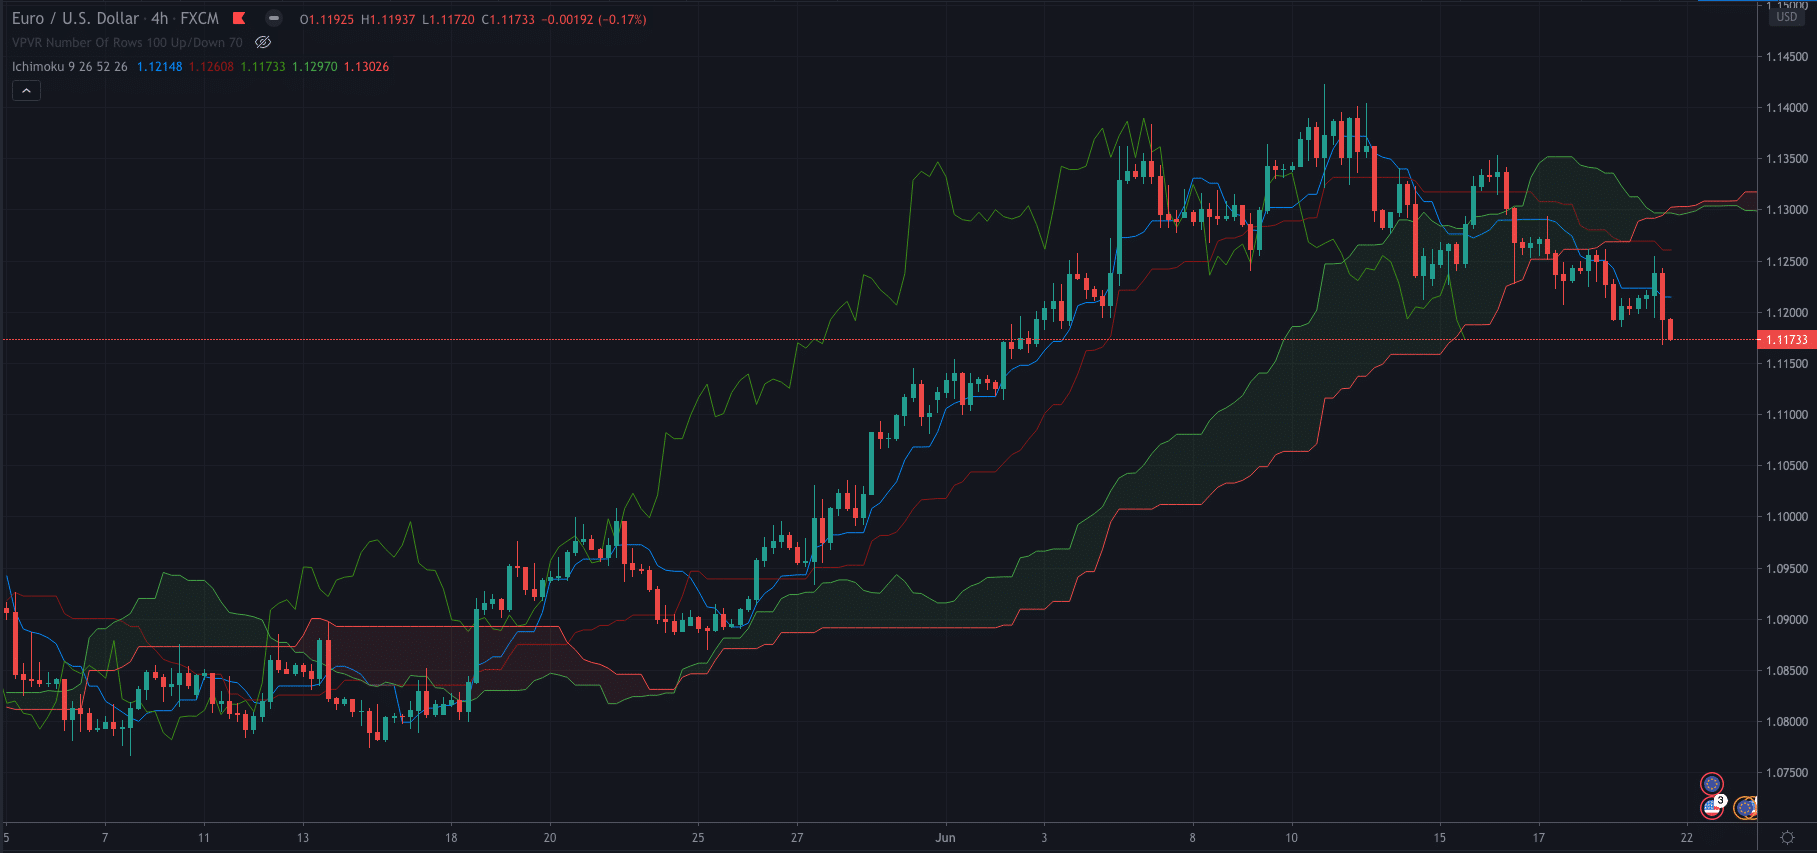
Ichimoku Cloud
The Ichimoku Kinko, or Ichimoku Cloud, is an indicator used to assess the strength of a trend along with future support and resistance areas.
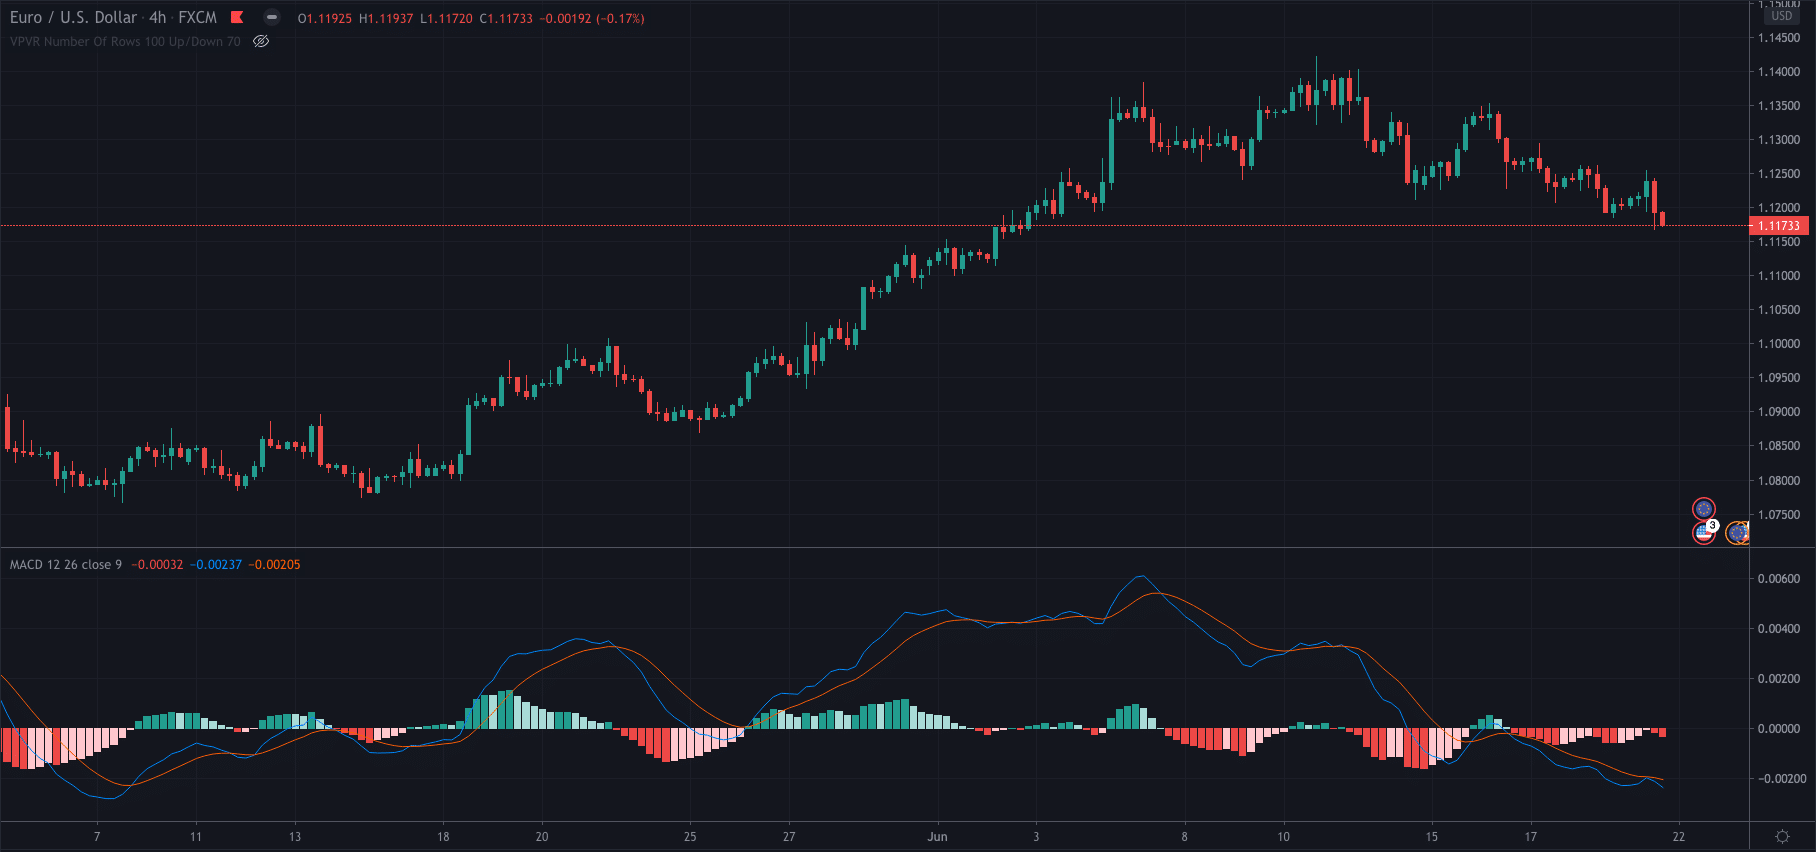
MACD (Moving Average Convergence/Divergence Oscillator)
The MACD shows the relationship between two moving averages of an asset’s price. The indicator is calculated by subtracting a 26-period Exponential Moving Average from the 12-period moving average.
Parabolic Sar
The Parabolic SAR is used to confirm the price direction or direction of a trend on any particular asset. It also helps to signal when a change in trend may occur, hence the SAR part of its name.
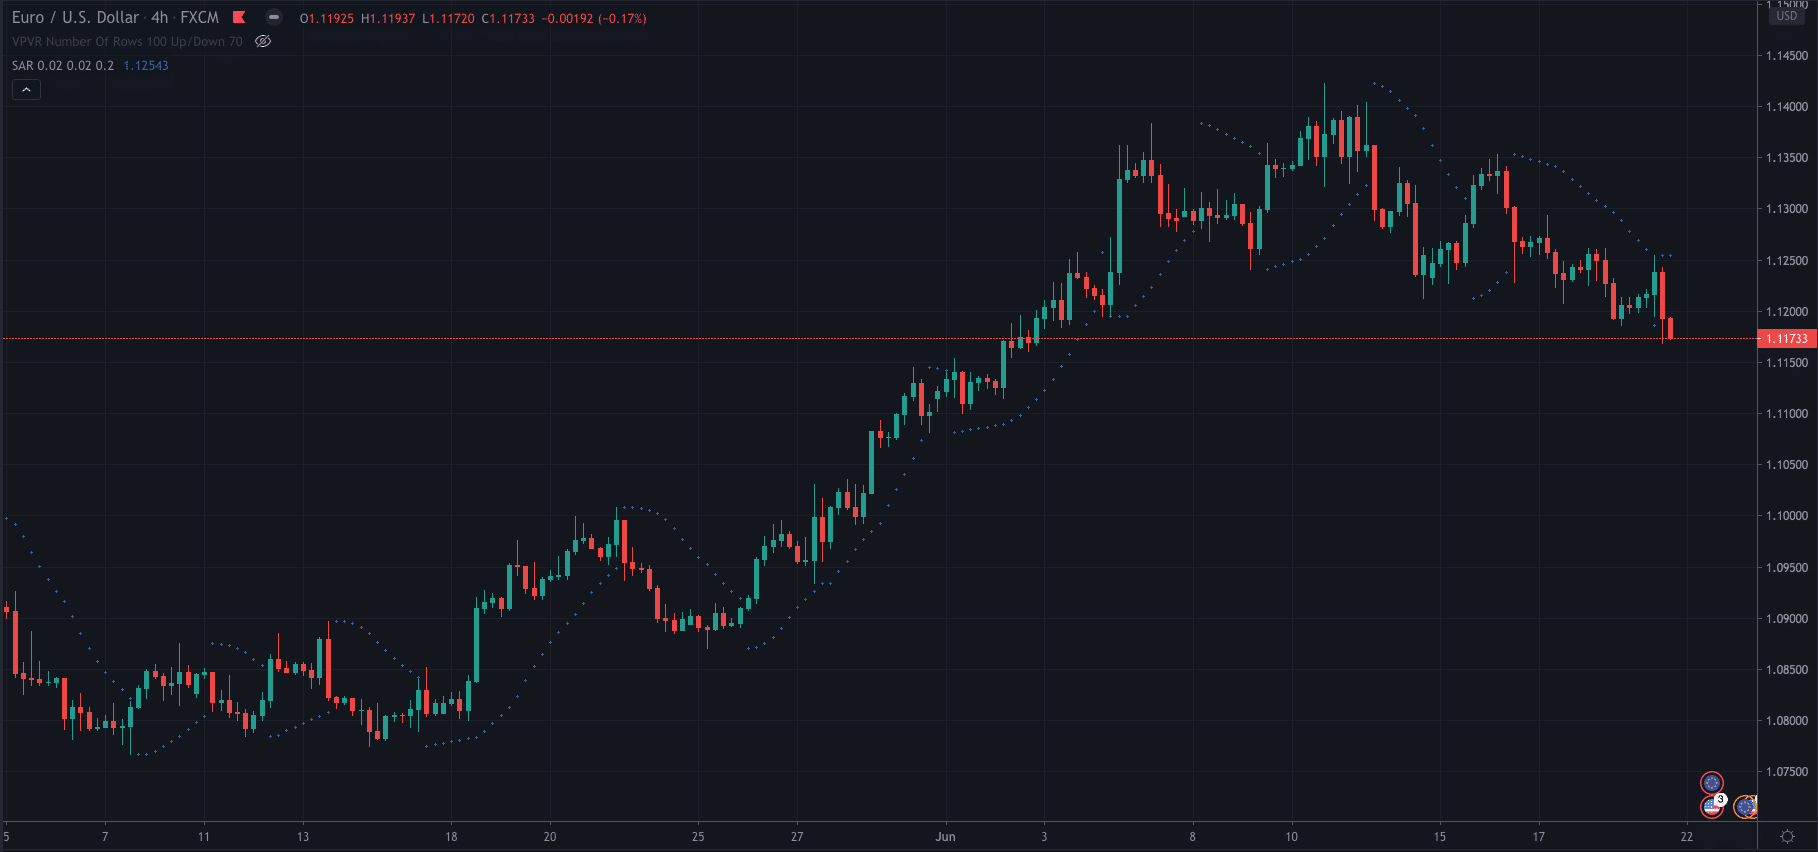
The indicator shows plots or a series of dots in various lengths and amounts. If the dots are below the current price action, this indicates that price is in a bullish trend. Alternatively, if the dots are above the current price action, then this shows a bearish trend.
Moving Average (MA)
A moving average calculates the average price over a specified period and is shown on the chart as a line that overlays the current price.
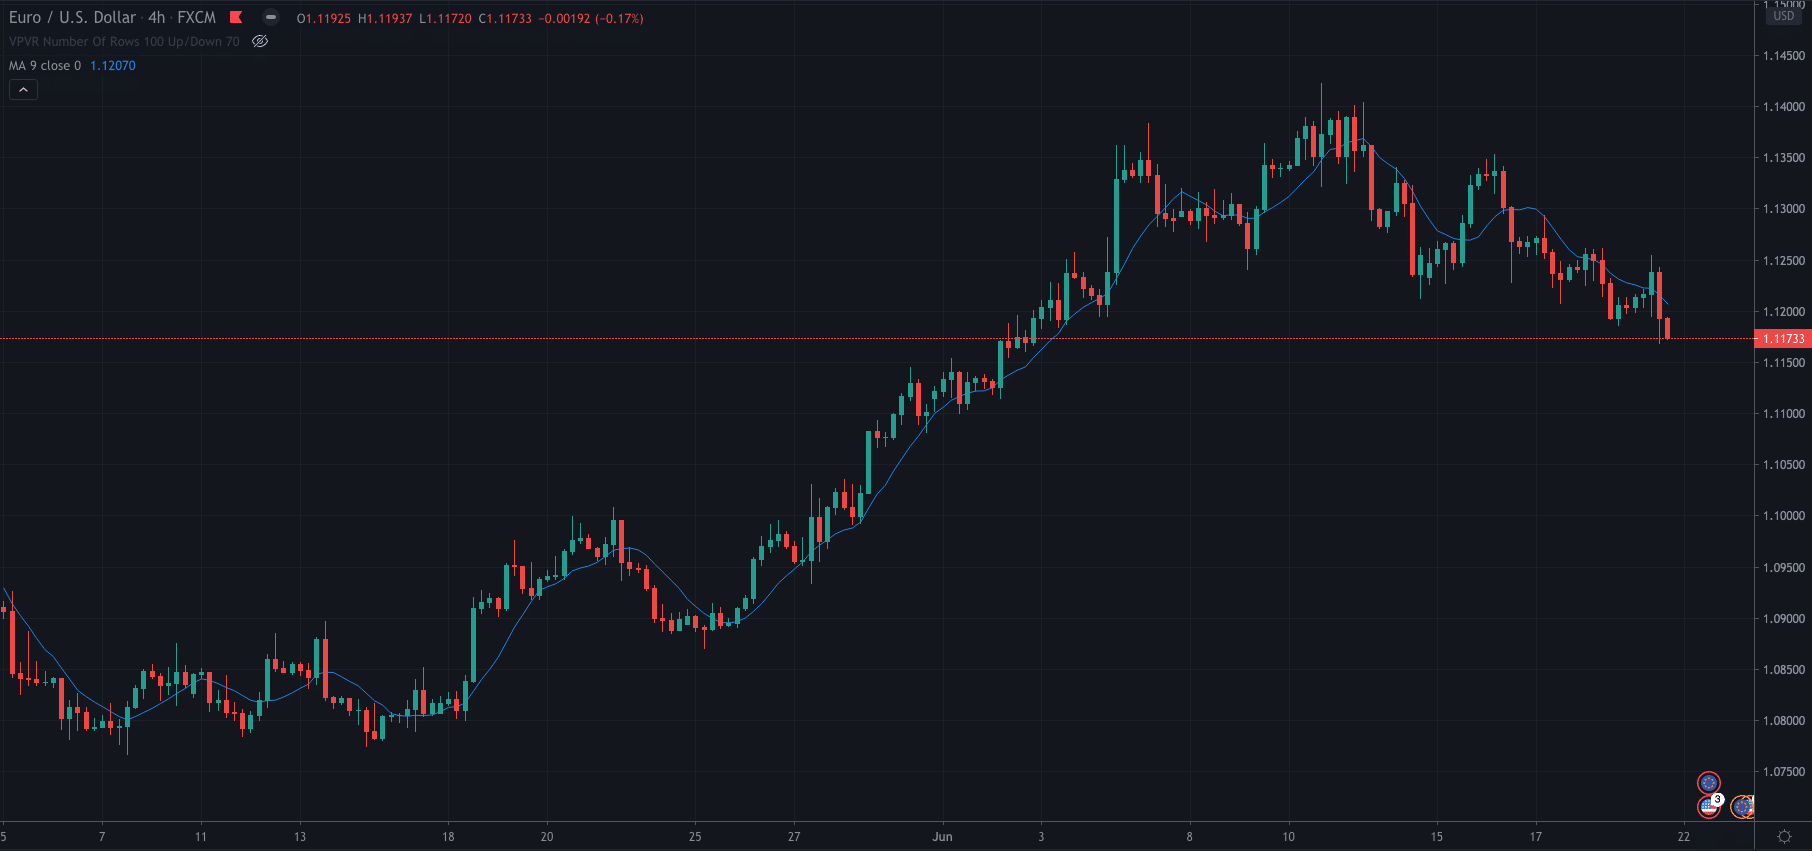
There are two different types of moving average, exponential and simple. Above is a simple moving average.
Momentum Indicators
Momentum indicators are used to analyse the speed and strength at which a security’s price is moving. They show the movement in price over time, and how strong those movements are.
To put it in simple terms, they provide analysis on the strength of a trend.
Momentum Indicator Examples
These are some of the most popular Momentum Indicators used by traders:
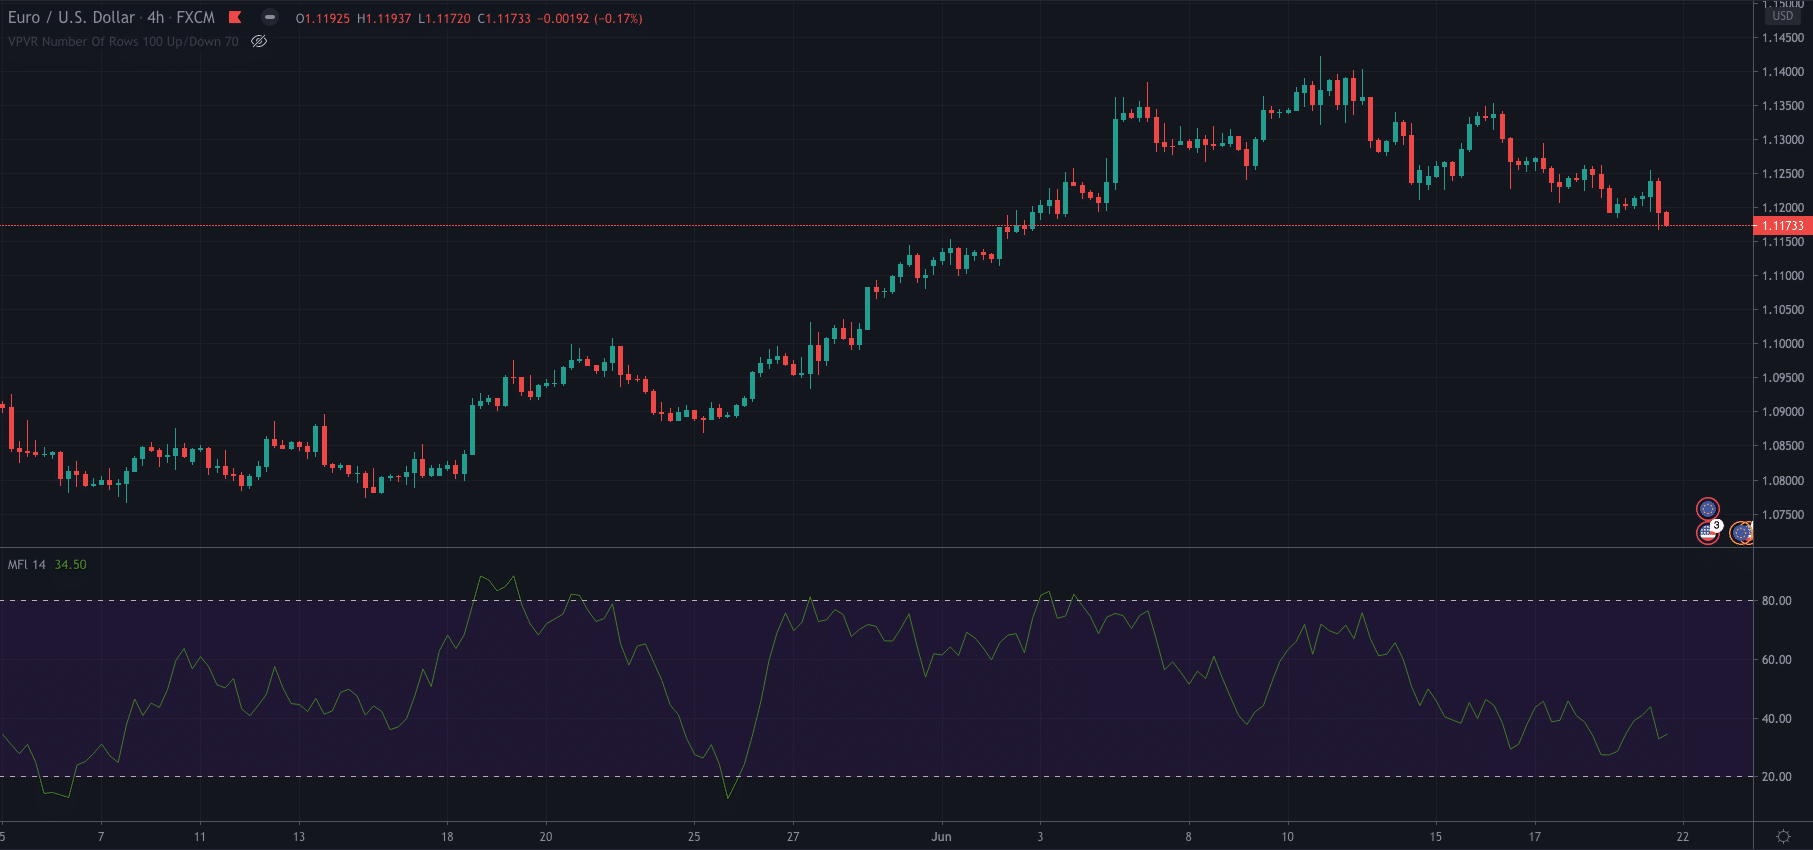
Money Flow Index (MFI)
The Money Flow Index uses price data and volume to determine levels at which price may be overbought or oversold.
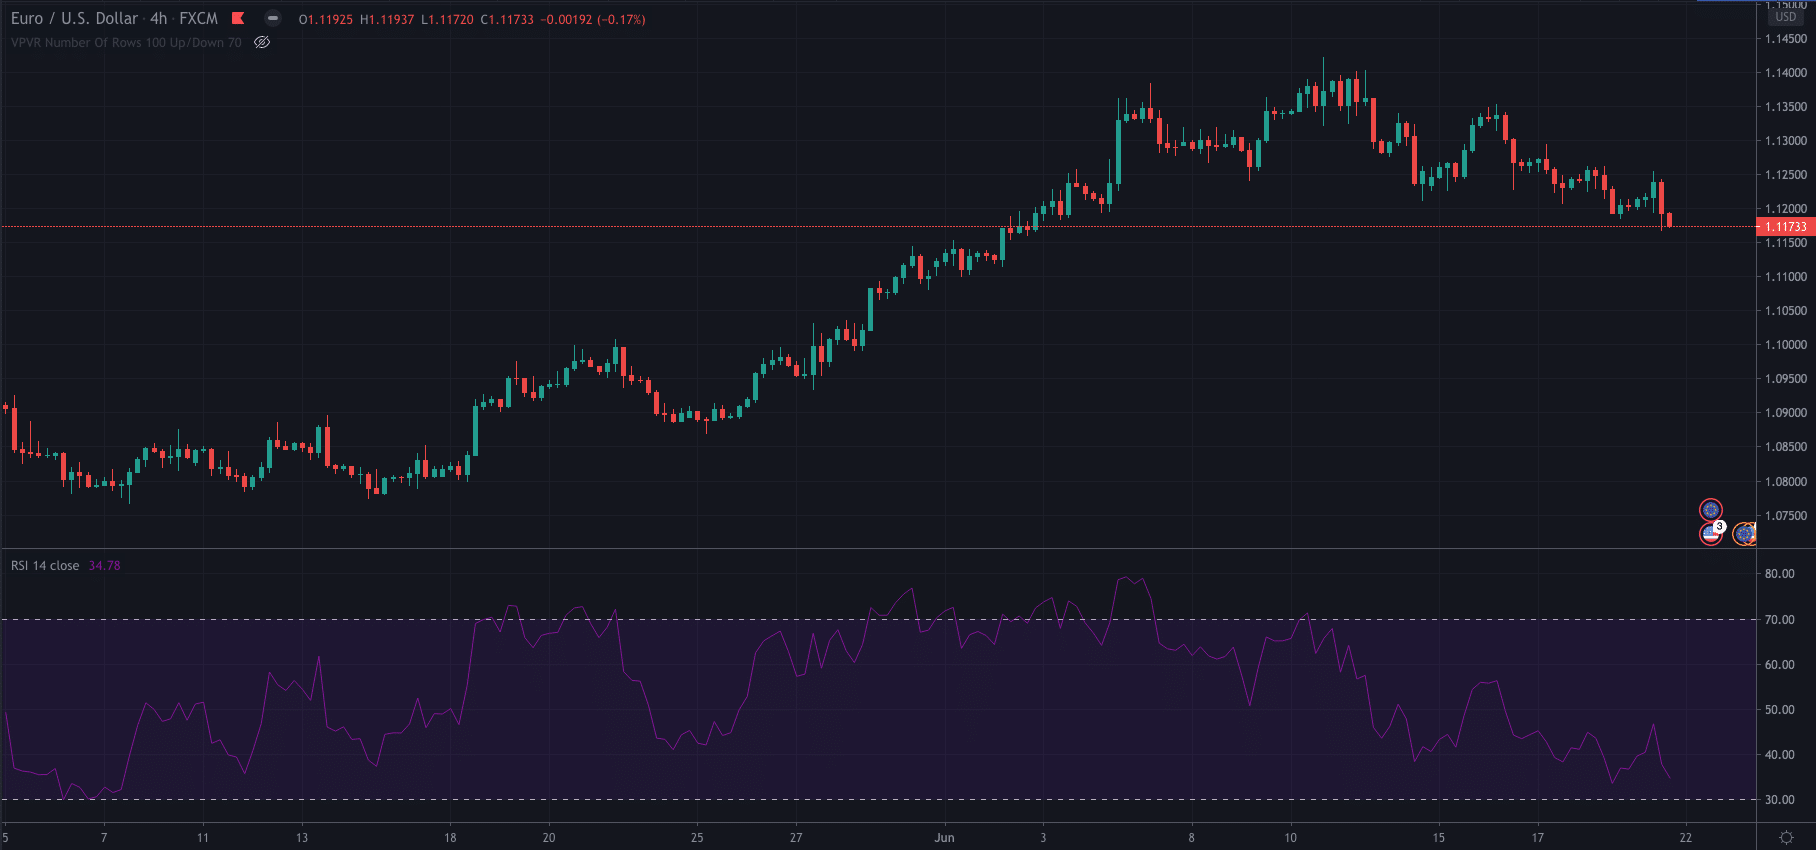
Relative Strength Index (RSI)
The RSI tracks market prices working as a momentum oscillator, which means its readings fluctuate between two charted extremes (0 and 100).
It too can also be used to determine overbought and oversold levels.
Stochastic Oscillator
The stochastic indicator compares the closing price of a certain asset to the average price over a specific period.
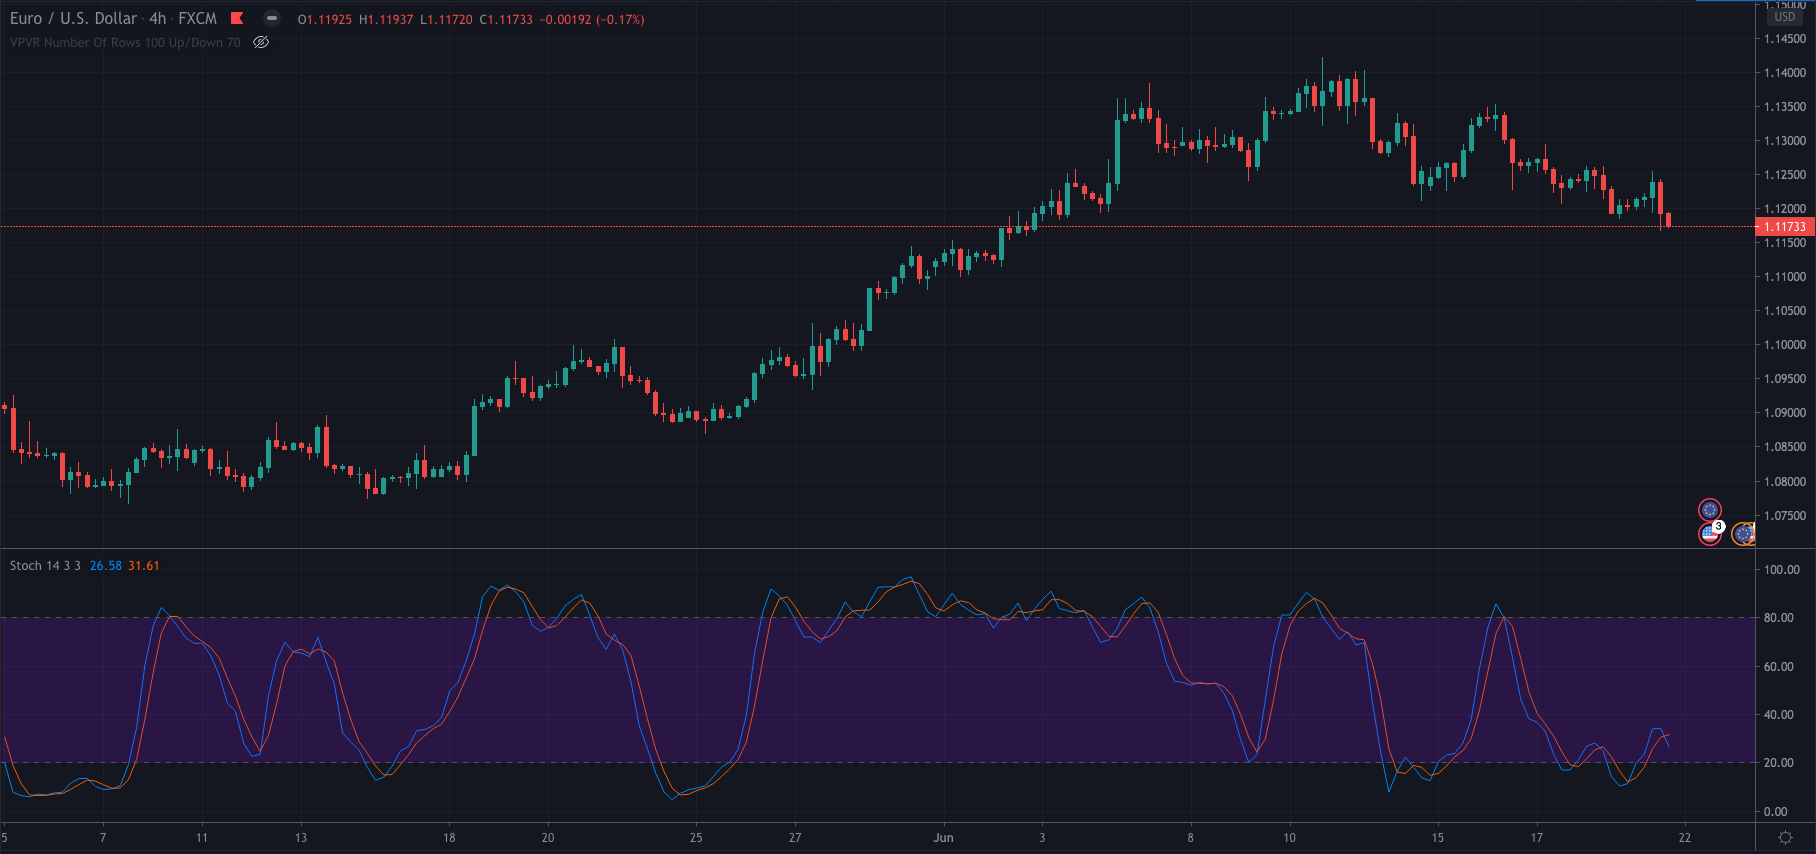
There are levels set at 80 and 20 that represent overbought and oversold levels if the price goes above or below them.
True Strength Index (TSI)
The True Strength Index is an oscillator that uses moving averages of the underlying momentum of a trend to provide overbought at oversold levels.

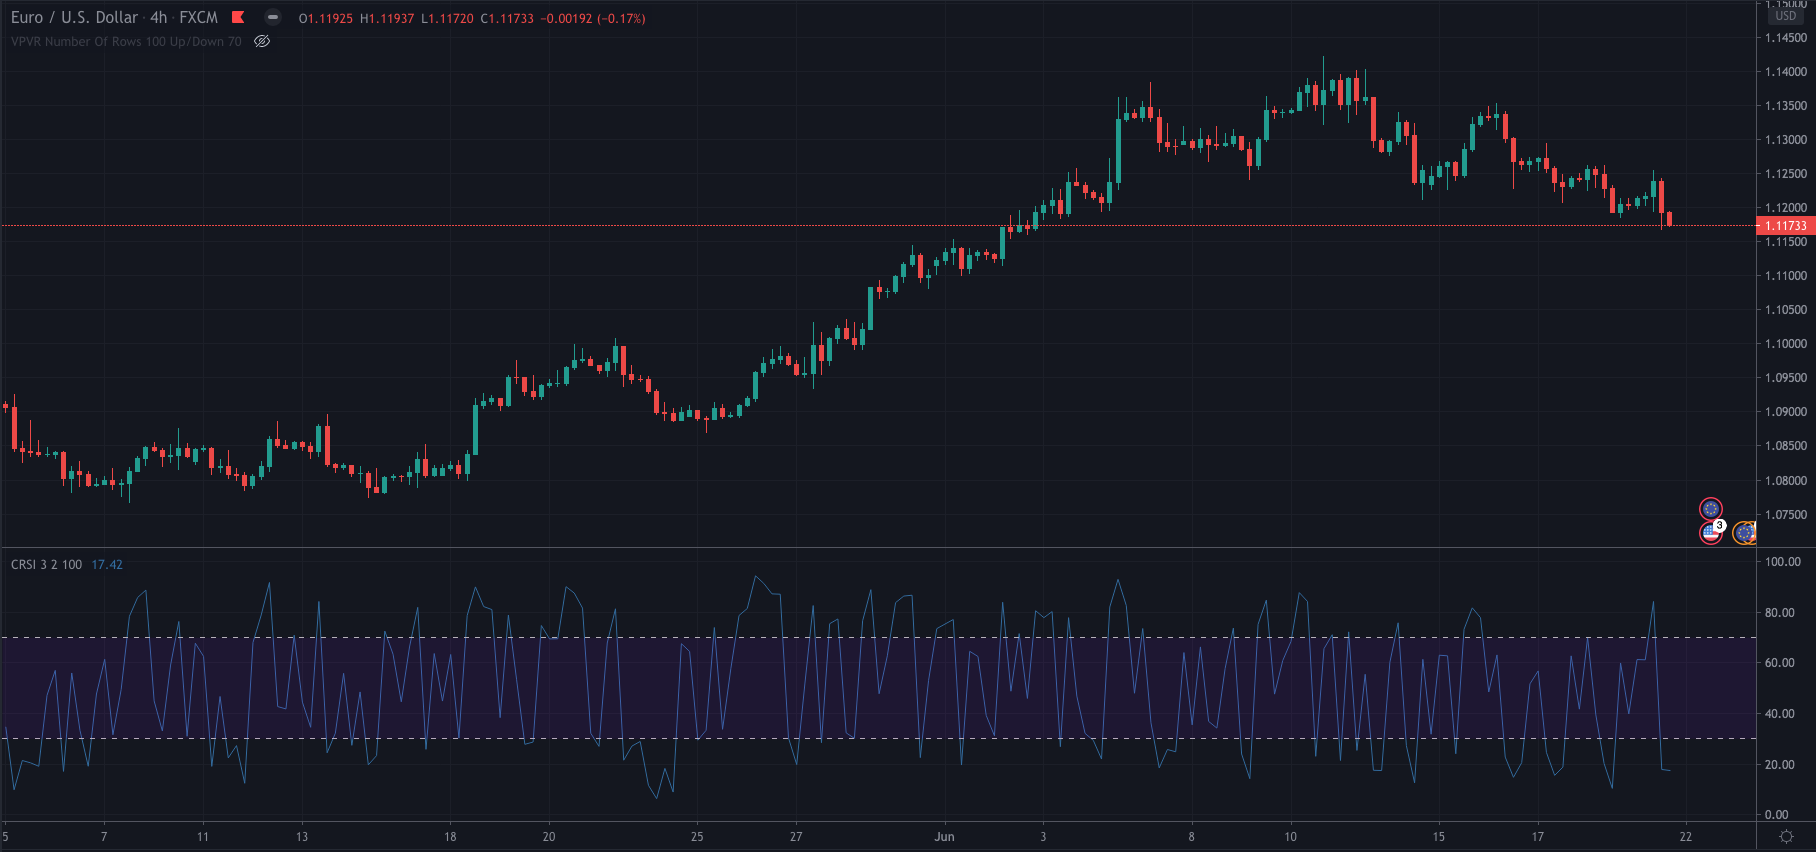
Connors RSI
This Connors RSI indicator uses the regular RSI indicator, market streak value and the rate of change to provide overbought and oversold signals.
Volume Indicators
Volume indicators, as the name suggests, show the amount of volume in the market you are assessing.
The volume is the amount the price of an asset changes over a certain period. For example, in stocks, it would refer to the number of shares traded throughout the day. Volume indicators are used to measure this.
Volume Indicator Examples
These are some of the most popular Volume Indicators used by traders
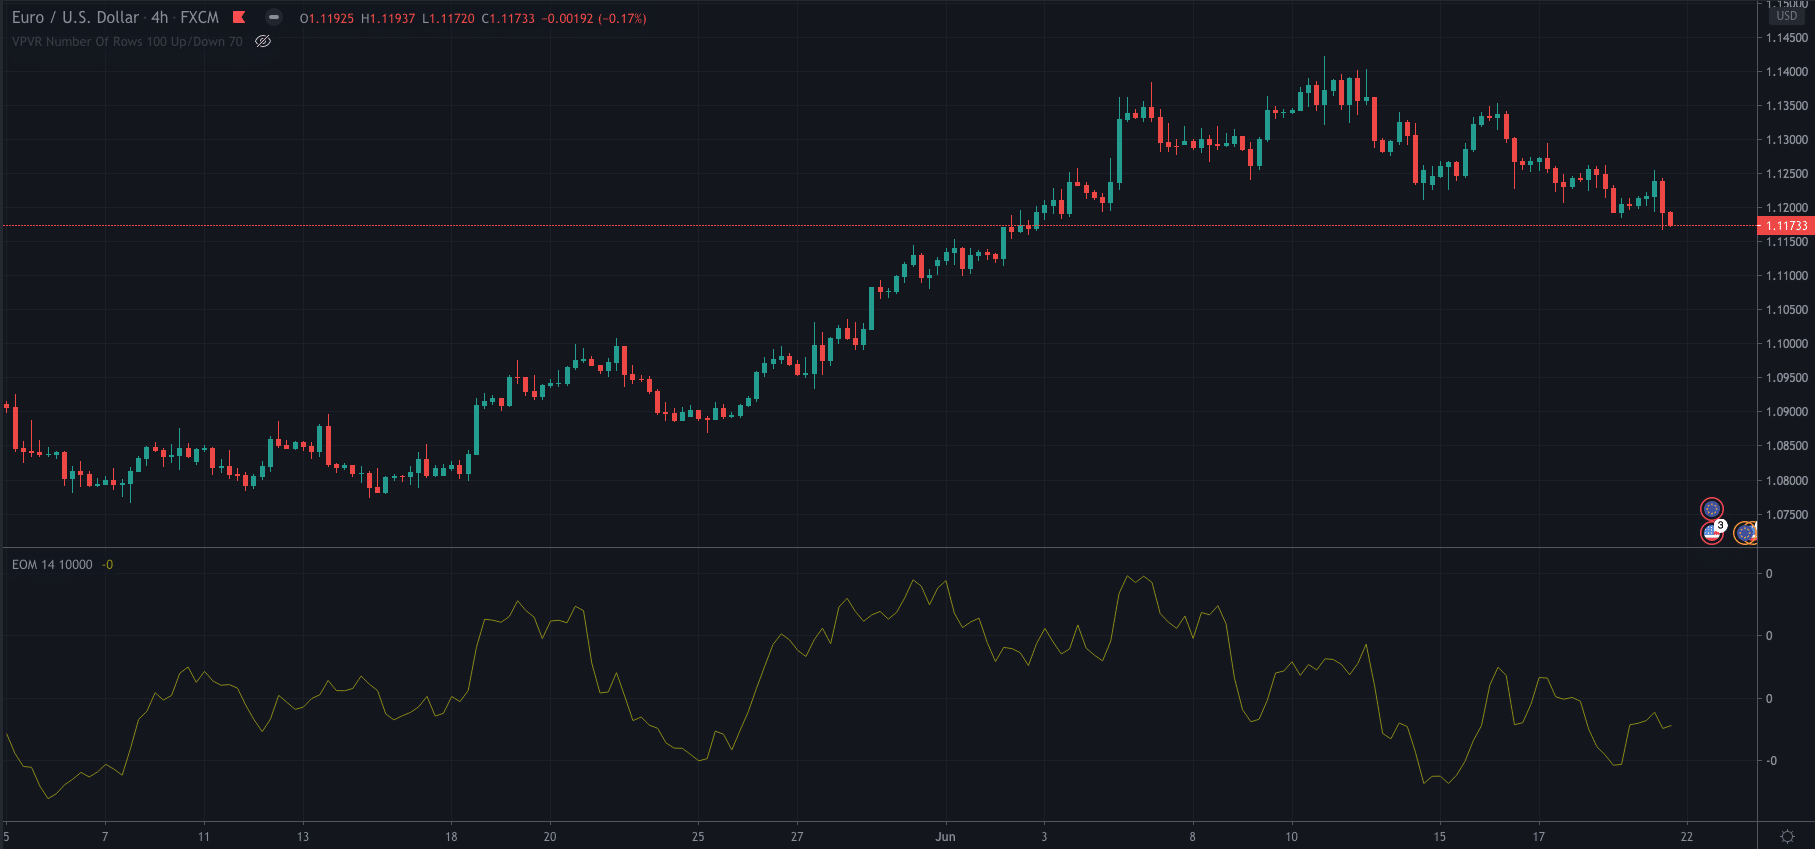
Ease of Movement (EMV)
This indicator uses both momentum and volume data and puts it into one value to ascertain whether prices will rise or fall.
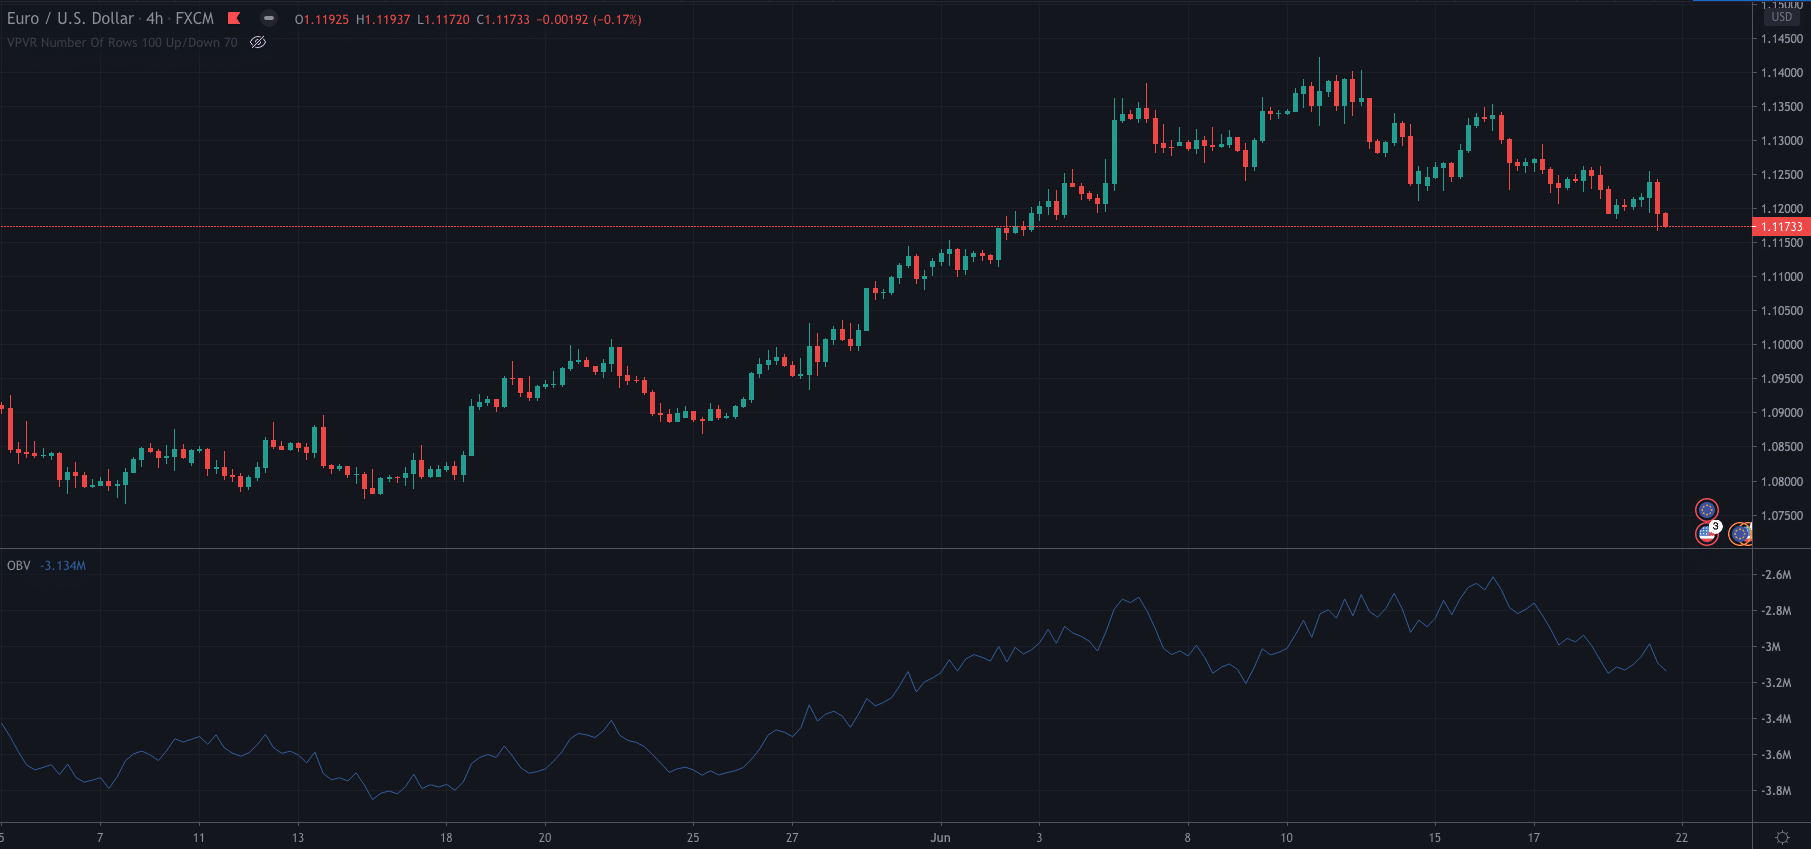
On-Balance-Volume (OBV)
The On-Balance-Volume uses volume flow to predict when there may be changes in price direction.
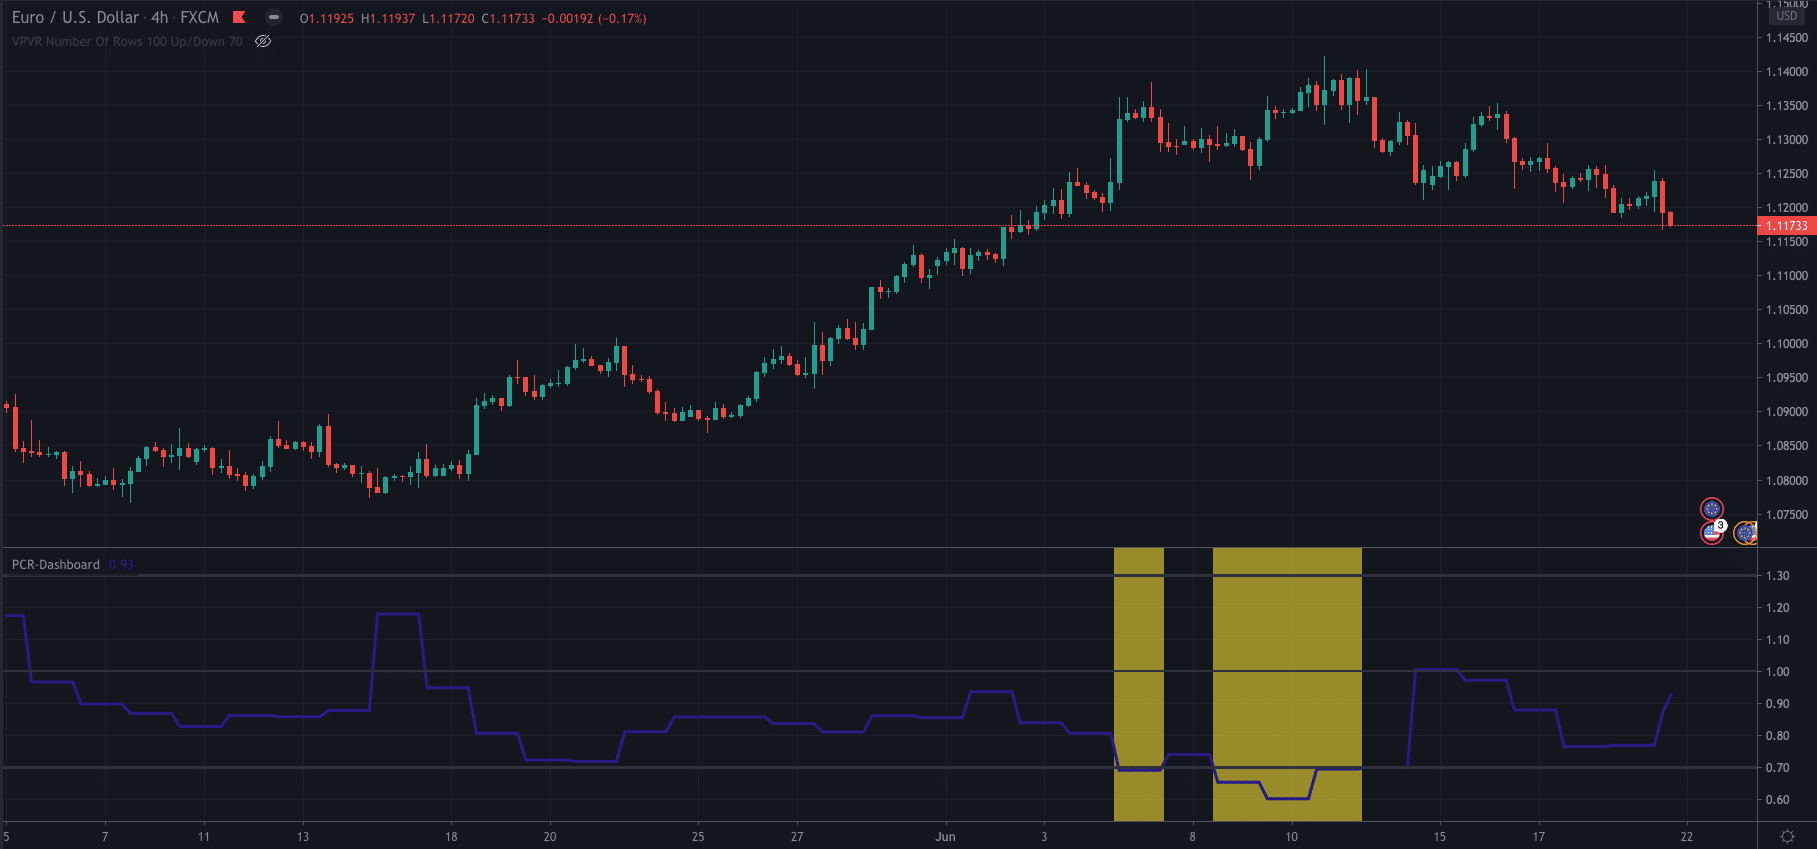
Put/Call Ratio (PCR)
The put/call ratio indicator analyses the options markets put and call volume. When the put/call volume is high the market is considered bearish and when it is low it is considered bullish.
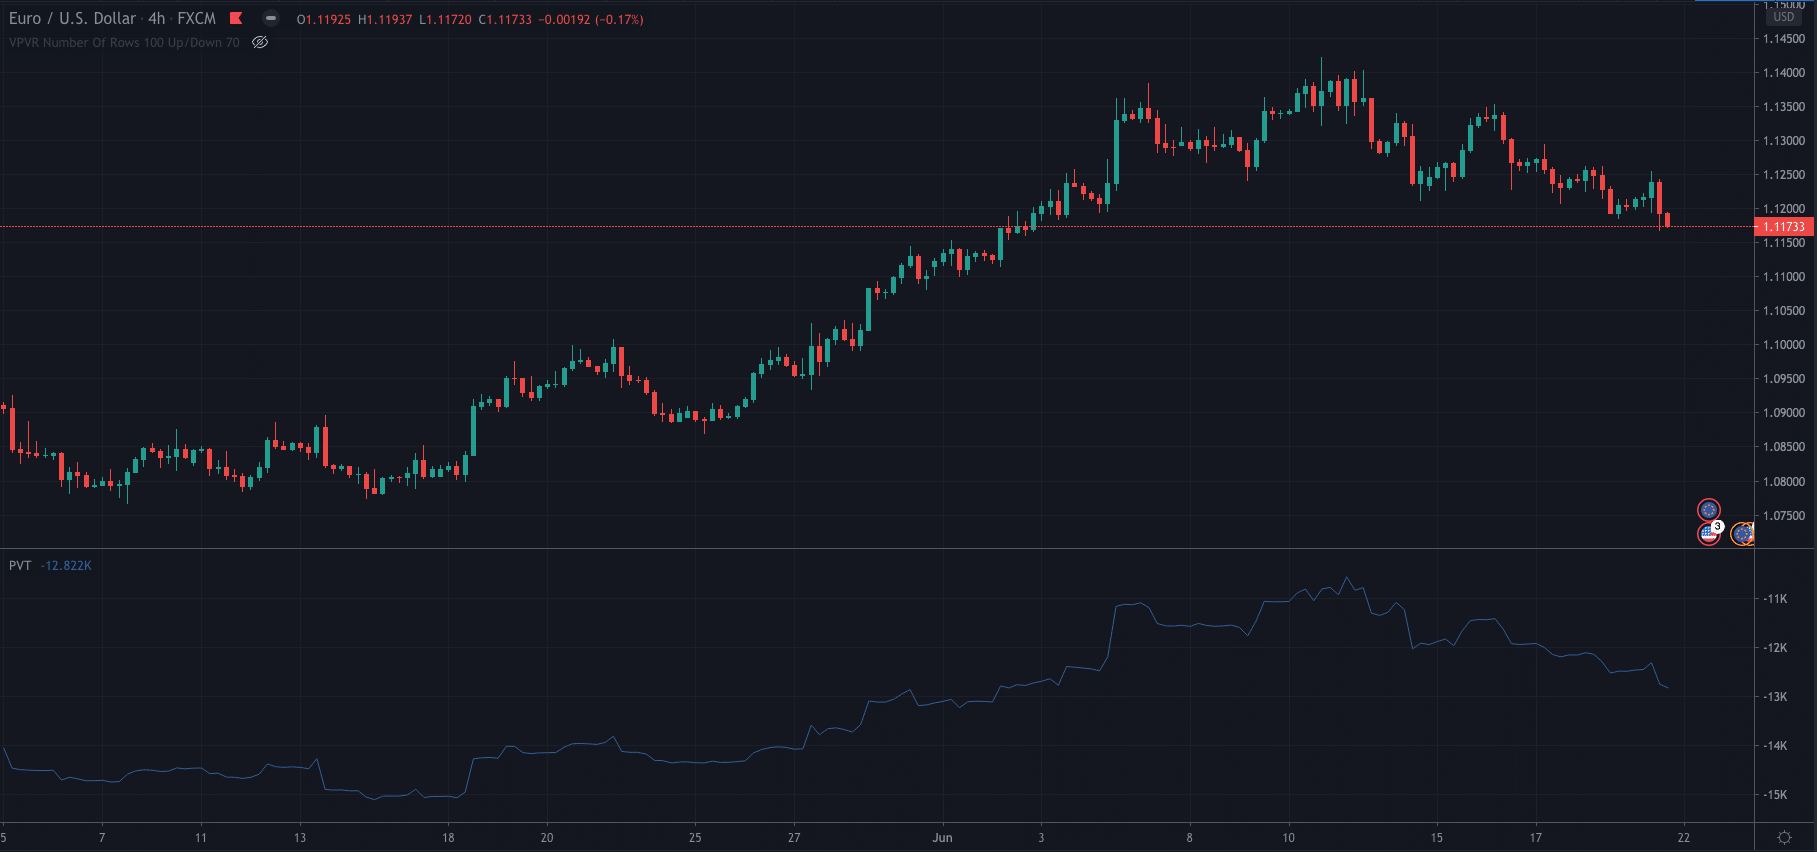
Volume Price Trend (VPT)
The VPT analyses the balance between the volume of supply and demand in the asset being assessed.
Volatility Indicators
Volatility indicators analyse how much the price has moved away from its average price over a specified period. For example, when an asset has a lot of volatility, the indicator will reflect that, showing it is far from its average price.
Volatility Indicator Examples
These are some of the most popular Volume Indicators used by traders:
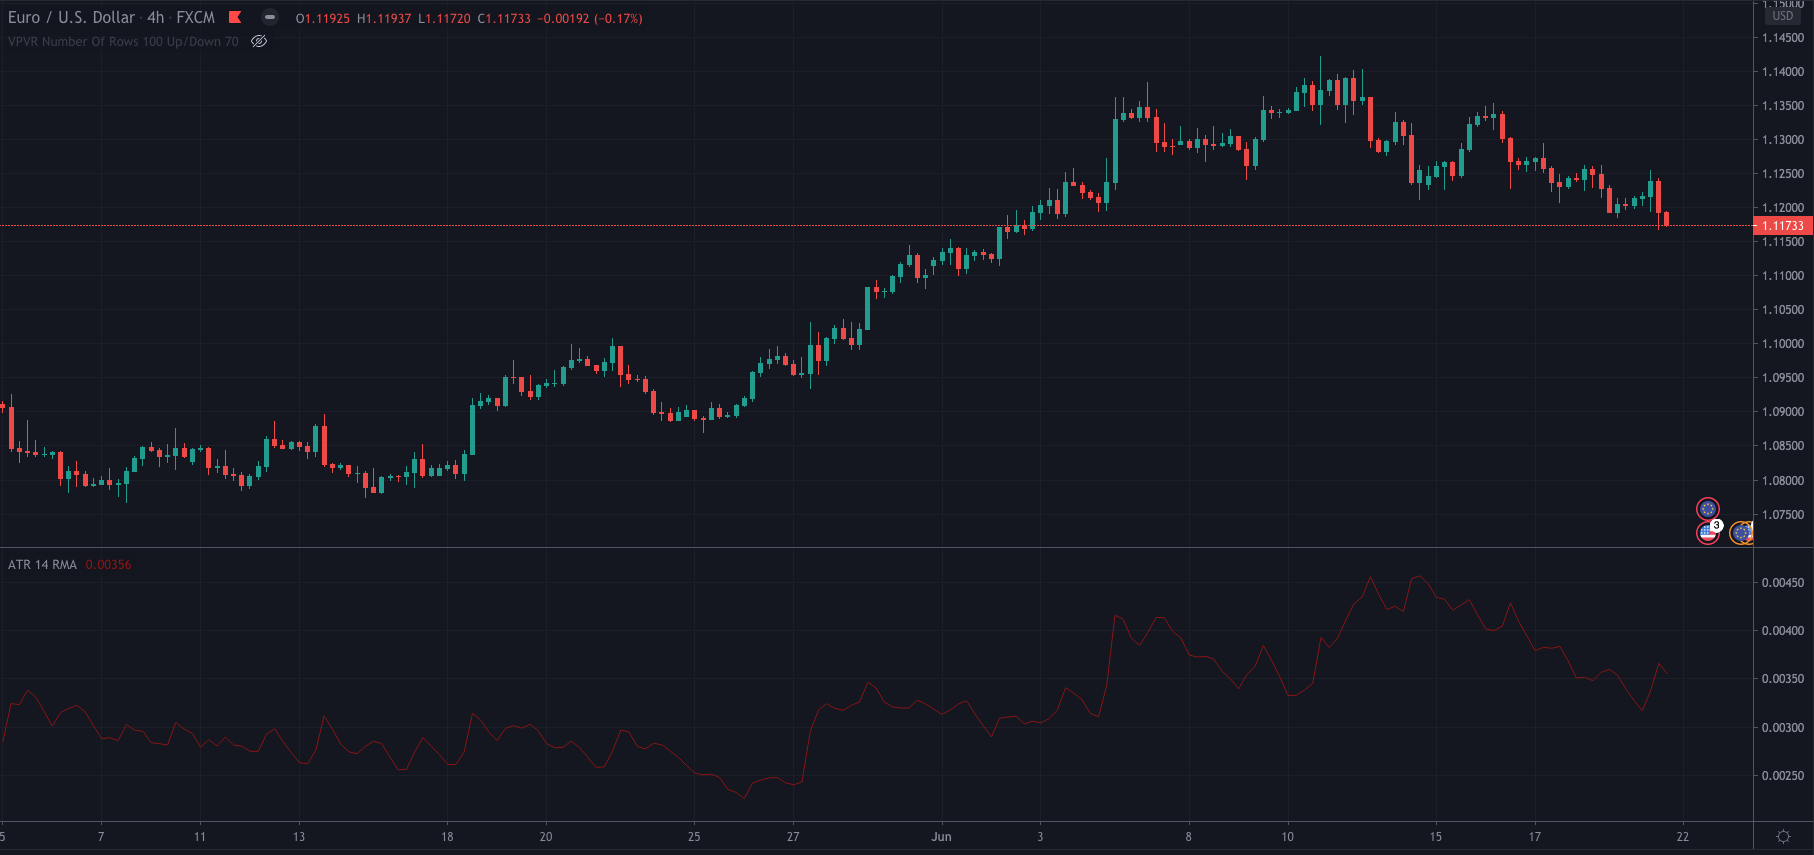
Average True Range (ATR)
The ATR indicator measures the assets price range for the period set in the ATR. For example, if you set a 20 candle period, the ATR will show the average range in price over that period of 20 candlesticks.
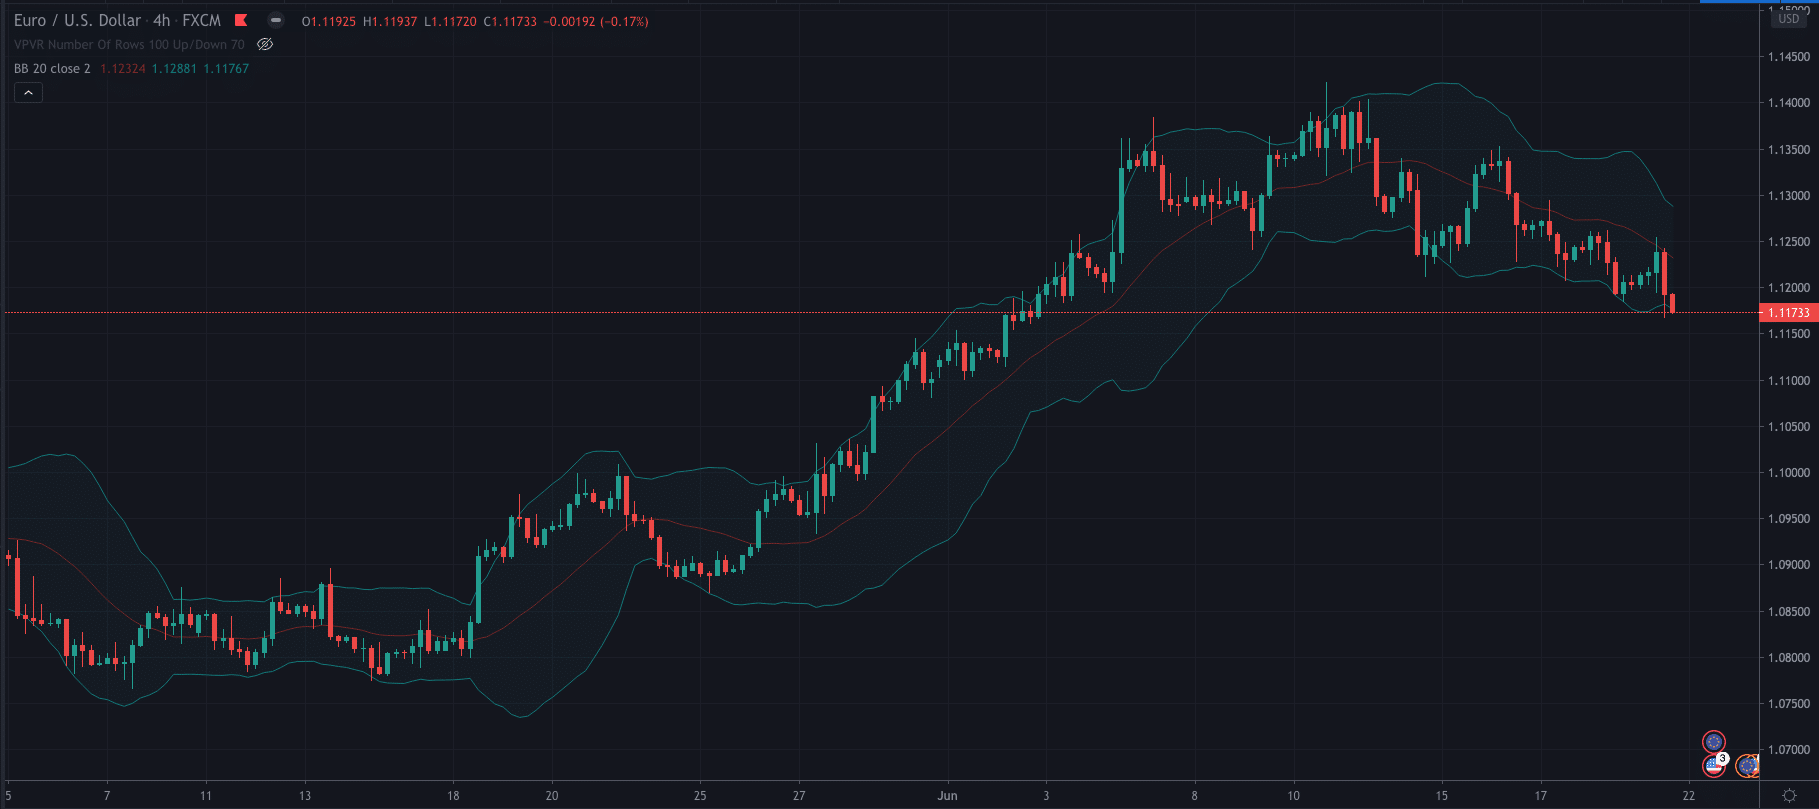
Bollinger Bands (BB)
Bollinger bands show pricing channels that are set two standard price deviations away from a simple moving average. The band characteristics can be adjusted to suit the user’s preference.
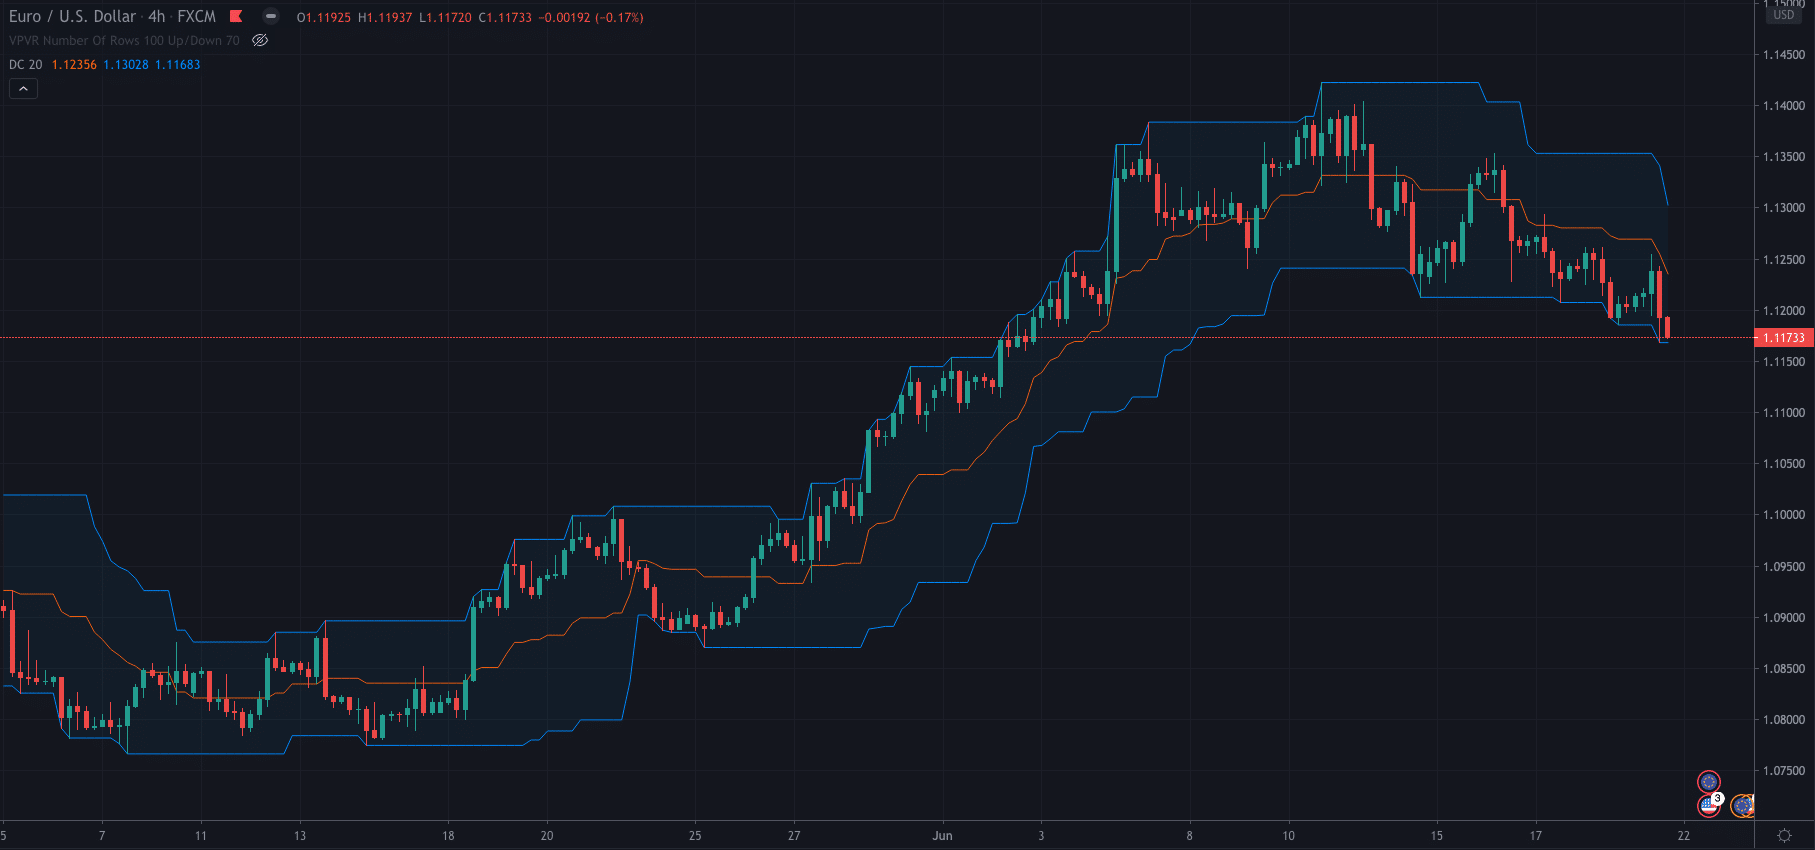
Donchian Channel
The Donchian Channel is created by using different moving average calculations. They show a band above price, one below the price and a median band.
Keltner Channel
The Keltner Channel is very similar to the Donchian indicator in that it shows three lines as well.
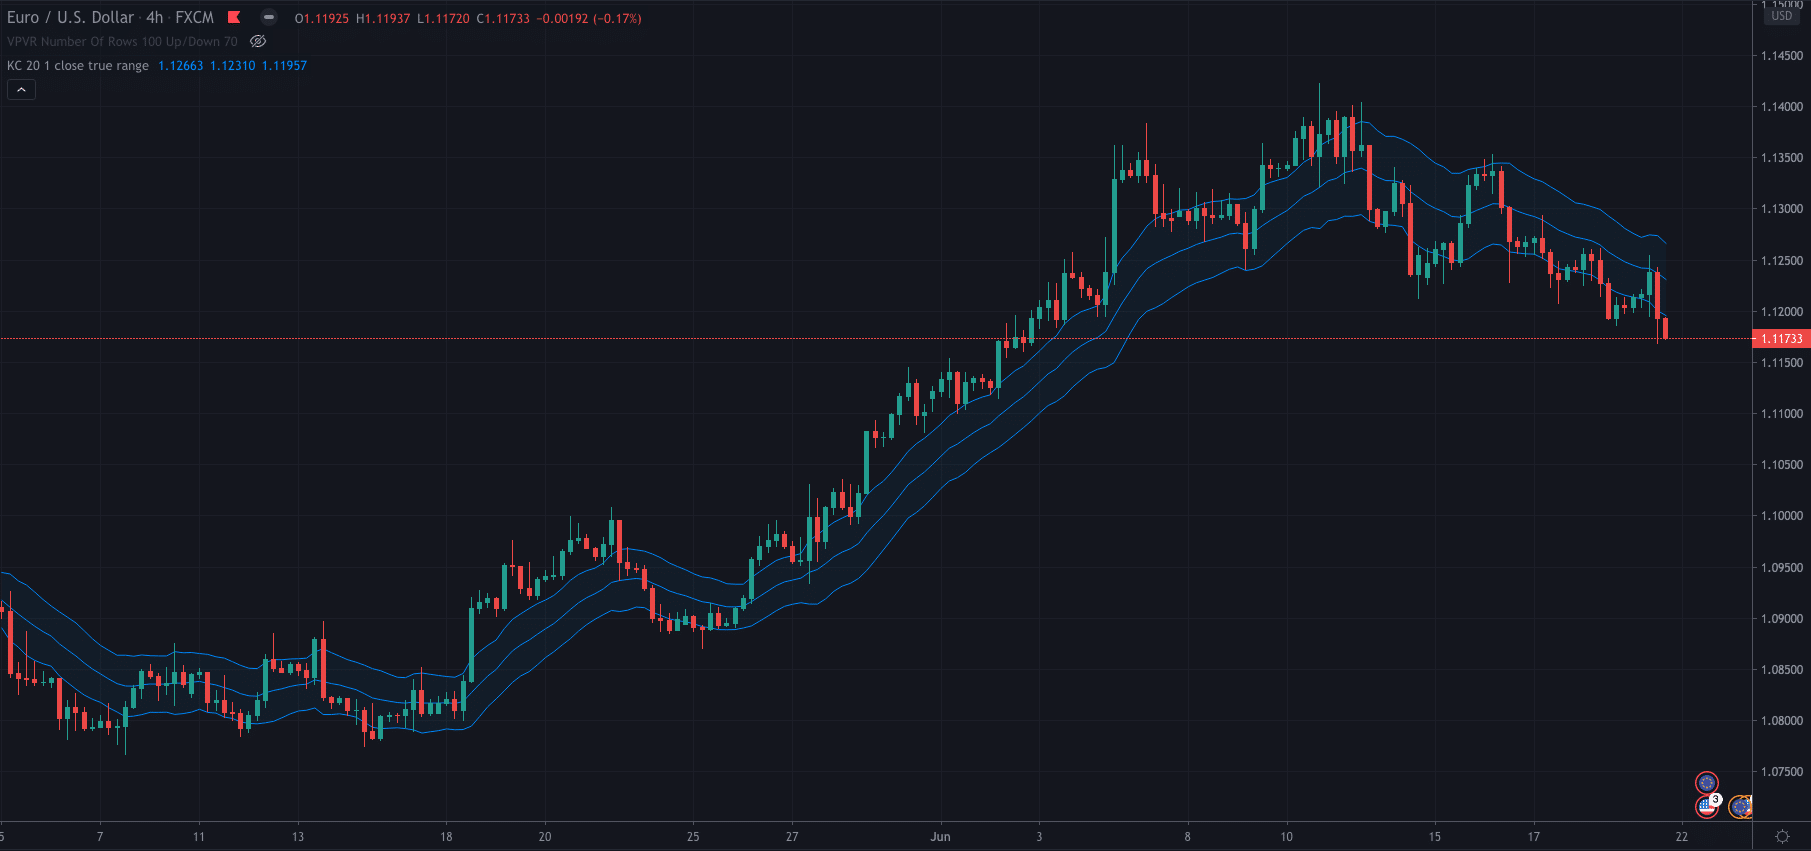
The line in the middle is an exponential moving average, the upper line is created using the Average True Range x2, and the lower line is set two times below the ATR. The lines then expand and contract as volatility increases and decreases.
What Are the Most Popular Technical Indicators?
If you’re a new trader, then are some indicators that you will see used all the time in the trading community:
- Moving averages
- MACD
- RSI
- Bollinger Bands
These are all commonly used amongst professional and retail traders.
What Are Leading Technical Indicators?
Leading indicators are indicators that attempt to give the trader an idea on the direction a market may be heading in. they can be used to generate signals for trade entries.
Some popular examples of leading indicators are:
- The relative strength index (RSI)
- The On-Balance-Volume (OBV)
- The Stochastic oscillator
What Are Lagging Technical Indicators?
A lagging indicator is one that lags behind price. Rather than pre-empting potential price movements, it instead reacts to price after it has moved
They can also be used to generate signals or confirm the strength of a current trend.
Some of the popular lagging indicators are:
- Moving Averages
- MACD
- Bollinger Bands
Technical Indicator Tips
So, to help you start your trading journey, here are some top tips to help you build your trading strategy:
- Don’t clog your charts. Simplicity is key, the more indicators you have on your charts the more confusing it will get for you.
- No indicator is full proof, make sure you filter your trades to make sure you try and avoid false signals
- Finally, as mentioned, no indicator is full proof, so it is important to backtest your strategy as much as you can to give you a statistical edge in the markets.
Conclusion
Now you know everything about indicators. However, it is important to note that indicators are only part of the strategy. Make sure to remember that testing your strategy rigorously is key to becoming a profitable trader.
If you think you’re ready to start testing your strategy then check out some of our broker reviews here. Or, if you want to learn more about how to trade technical indicators you can check out our articles on the EMA crossover strategy or the MACD strategy.
PEOPLE WHO READ THIS ALSO VIEWED:
- Here are our latest trending stories
- Trade stocks with top-rated Pepperstone
- Explore and learn bollinger bands strategy