
Understanding the nature of those huge funds and the money flow index indicator they use to trade offers an insight into the direction the market is heading. The technical analysis they use is largely based on price action – which is as straightforward as identifying if a chart is heading up or down. An additional level of complexity is provided by considering the volume of trades. Together, those metrics help them identify the top and the bottom of the market.
S&P 500 Index – Daily Price Chart – May 2018-May 2022 – Bullish price action & trendline break
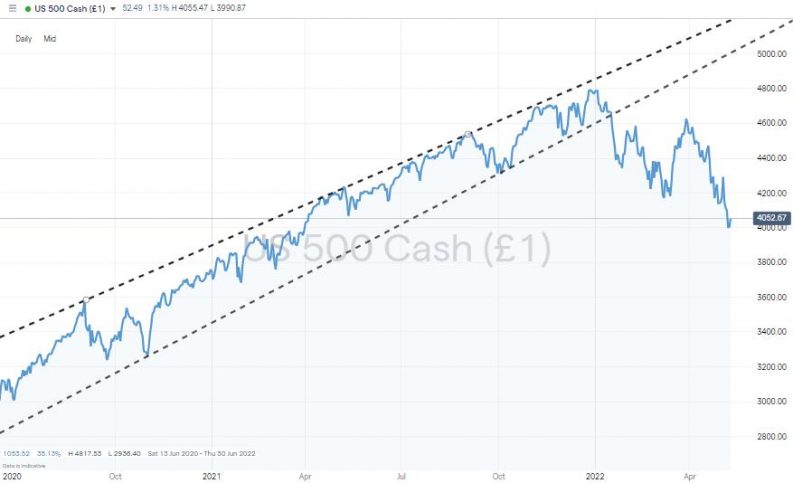
Source: IG
How to Trade Using the Money Flow Index
- Technical Analysis & Trade Volumes
- The Basics of the Money Flow Index
- The Money Flow Index Explained
- Money Flow Index Divergence
- Potential Downsides of Using the Money Flow Index
- How to Trade Using the Money Flow Index
Technical Analysis & Trade Volumes
The role of trading volumes is best described by considering the price of an asset being determined by a shootout between bulls and bears. If markets are quiet and trading volumes are low, then a 1% price rise in a stock, commodity, bond or currency suggests that price will continue to rise. A smaller percentage change – for example, 0.2% – could be a more reliable signal of future price direction if trading volumes are higher. The ‘battle’ between buyers and sellers in the second instance resulted in a smaller price move, but more market participants were engaged in the process.
S&P 500 Index – Daily Price Chart – May 2018-May 2022 – With trade volumes
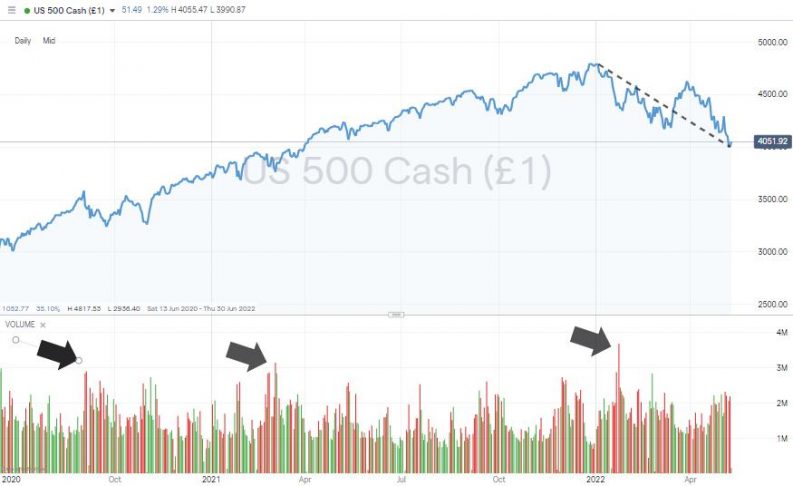
Source: IG
Fortunately, most good brokers offer a range of technical tools that can be applied to price charts to identify moves in trade volume as well as price. The colour of the bar will be determined by whether price moved up or down during a particular time interval, and the size of the bar offers an indication of how much trading took place.
The Basics of the Money Flow Index
The Money Flow Index (MFI) takes trade volume-based analysis to another level of user-friendliness. It combines price and trade volume data into one metric, which can then be used to identify if a market is overbought or oversold.
A market is generally considered overbought if the MFI is at 80 or above. This can be a signal to ease out of some positions and lock in profits, but selling short would take a degree of courage as without an external shock acting as a catalyst for downward movement, stock markets can carry on drifting upwards even though the MFI is over 80. There is always an end to the trend, but effectively timing sell trades is hard to do.
An MFI of 20 or less is a sign that a market is oversold. This is an indicator that many use to spot the bottom of a market. Price crashes in stock markets tend to be shorter and more extreme. This is due to the nature of panic selling and the way that investors who are leveraged have to liquidate positions to meet margin calls – which creates a cycle of selling pressure generating even more selling pressure.
The guide on how to hold your nerve when markets sell off looks into the possible responses to a price crash. One obvious response is to buy in at the bottom of the market and take advantage of the fact that markets tend to overshoot. The MFI is an ideal tool to use to try to spot those rare and potentially very profitable moments.
The Money Flow Index Explained
The MFI is an oscillator-type indicator. These construct high and low bands between two extreme values, and then build a trend indicator that fluctuates within these bounds on a real-time basis. The RSI is another oscillator indicator, and both the RSI and MFI have a range of 0 to 100.
Fortunately, the workings behind the scenes will be carried out by the broker and the MFI displayed as a single number, but the formula for calculating the MFI is as follows:
Typical Price = (High + Low + Close)/3
Raw Money Flow = Typical Price x Volume
Money Flow Ratio = (14-period Positive Money Flow) / (14-period Negative Money Flow)
Money Flow Index = 100 – 100 / (1 + Money Flow Ratio)
Standard market practice considers 80 and 20 as levels at which markets are overbought and oversold, but other levels, such as 90 and 10, or 70 and 30, can be used. Good brokers such as IG will have functionality that allows you to set your charts to those different levels to make it easier to identify those moments when different levels are hit.
S&P 500 Index – Daily Price Chart – May 2018-May 2022 – MFI <20 & Matching Price Rally
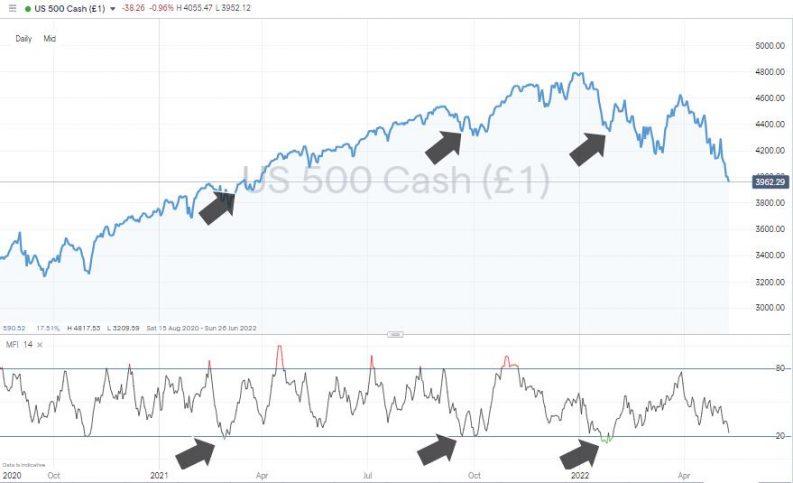
Source: IG
What level you use will come down to personal preference and the risk-return of your strategy. A 70-30 setup will have a higher frequency of trade entry points, but may not be as reliable. A 90-10 setup may be more reliable and offer a chance of a lifetime trading opportunity, but might be triggered only rarely.
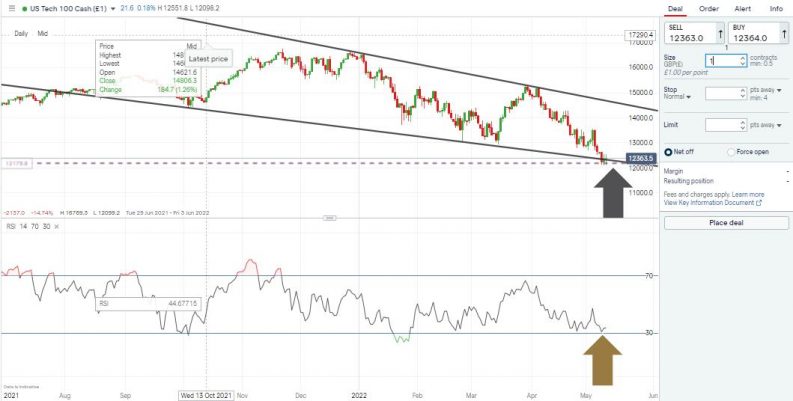
S&P 500 Index – Daily Price Chart – 2022 – MFI at 23.15
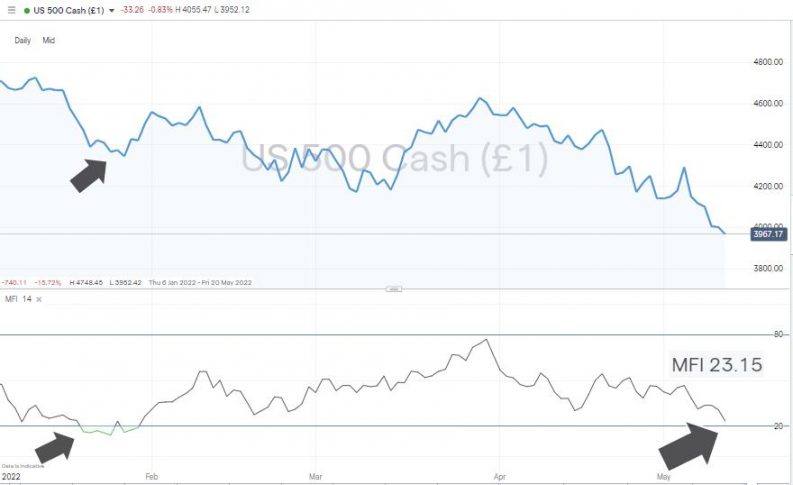
Source: IG
Using the daily price chart of the S&P 500 index, the MFI on 11th May 2022 was 23.15, which suggests that a buy signal could soon be triggered, but equally that price could continue to fall before the rebound comes into play at a lower level.
Money Flow Index Divergence
One of the benefits of the MFI is its potential to act as a leading indicator. Indicators that are useful in terms of pointing to where price might next head, rather than outline where it has been, are for obvious reasons much sought after.
A divergence between the MFI and price, when both metrics are moving in opposite directions, is especially noteworthy. If, for example, the indicator is rising while the underlying price of the asset is falling or flat, then this could mark a point where the market is bottoming out and price will soon start rising.
S&P 500 Index – Daily Price Chart – 2022 – MFI rising while price is falling – then price rallies
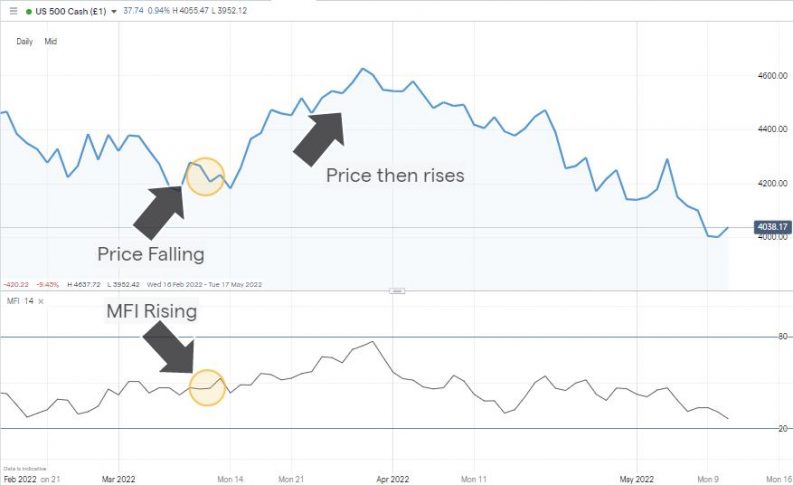
Source: IG
A bearish divergence is characterised by the MFI falling while price is rising and can signal the top of the market and an impending sell-off.
The Benefits of Using the Money Flow Index
The MFI uses two core aspects of market activity: price and volume. This means that the model has an intuitive feel and deals with two of the most important elements of any market. Having fewer variables can sometimes make a model more robust, and inspection of the granular detail is also easier to complete than if a model has a greater number of data inputs.
The indicator can be used in any market that provides reliable source data, so once you’re familiar with the principles, it’s possible to use it to trade anything from crypto to commodities. If your portfolio is equity-focused, then the MFI can be used whether your target sector is growth stocks, dividend stocks or green energy stocks.
The MFI also works over any timeframe, so it can be applied to day trading strategies. It can be used to identify opportunities to put on trades with holding periods ranging from minutes to days and months.
The MFI is a widely used tool. Some indicators can be effective just because members of the trading community know, or assume, that other parties will be using them. Those big quant funds that make up so much of the trading volume of modern stock markets use a variety of indicators, but the MFI will very likely be one of them. If the big money is using an MFI of <20 as a sign to buy, then going with that trend can help smaller investors piggyback on a subsequent price surge.
Potential Downsides of Using the Money Flow Index
Like all technical indicators, the MFI considers historical data to try to offer a prediction on future moves. The ‘looking in the rear view mirror while driving forwards’ aspect of technical analysis is the MFI’s major weak point.
It is also recommended to use a combination of indicators in conjunction with each other. Requiring, for example, three separate indicators to all be showing the same outcome, buy or sell, can reduce the chance of trading off one signal that proves to be inaccurate.
One potential downside to trading the MFI is that short-selling when the index is overbought can incur daily financing charges. These aren’t particularly large in relation to the profits that can be made on a trade, but they do need to be factored in if you’re holding a position for an extended period.
If you’re looking to buy a stock when the MFI is at 20 and hold that position for weeks rather than days, then it will be more cost effective to trade in the underlying stock rather than a CFD position. When completing a cost-benefit analysis of your strategy, it’s worth considering this in-depth report on the pros and cons of trading CFDs and shares. The good news is that most of the top-tier brokers offer both services from the same account.
How to Trade Using the Money Flow Index
Whether you are new to trading or an experienced investor considering using the MFI for the first time, one good first step is to use a demo account. These take moments to set up and usually require providing little more than an email address. They offer all the functionality of a live broker platform, but as the funds are virtual, they are risk free. This means that you can test your strategy and the broker at the same time and establish if they are a good fit for your style of trading.
1. Find a Broker
Rule number one of successful investing is ensuring that you set up with a safe broker. Trusted firms found on this shortlist of good brokers are regulated by some of the most highly regarded financial authorities in the world. They’ve also been reviewed by the AskTraders team to ensure that they offer T&Cs, technical analysis tools, and price charts appropriate for using strategies based on the MFI.
2. Open & Fund an Account
Setting up an account is done online using a handheld or desktop device and takes a matter of minutes. It’s a straightforward process, and once you’ve provided the required ID, you’ll be able to wire funds to your account, and some payment options such as debit and credit card allow for immediate transfer of funds. Most good brokers don’t charge commissions on cash transfers, so checking the T&Cs can help you avoid those that do.
Instruction to Buy 1 Contract of S&P 500 Index
Source: IG
3. Set Order Types
Whether you are buying long at an MFI of 20, or selling short when the MFI reaches 80, both approaches can take advantage of risk management tools, including stop-loss, take-profit and limit orders. These are instructions that you can input into your account to automatically trade out of a position at a predetermined price level. They manage risk by ensuring that a bad trade doesn’t blow up your account and can lock in profits if price suddenly spikes.
Automated orders help those looking for a hands-off way of trading and remove the need to watch the markets 24/7, but some long-term investors decide to not use them. Stop-losses can be triggered during a momentary price fall and kick traders out of positions that ultimately come good. Take-profit instructions lock in gains, but by definition also cap potential upside on a trade. Alternative risk management techniques include trading in small size and portfolio diversification.
4. Select & Buy Shares
Whether you’re buying copper or crypto, the process of pulling the trigger on your trade involves locating the market on the online dashboard, entering the quantity of shares you want to buy, and clicking ‘Place Deal’. At that point, you’ll exchange an amount of cash for a holding in an asset, which will go up and down in value in line with the market prices. When the time comes to close out your position, simply reverse the process and crystallise your trading returns.
Final Thoughts
There are a lot of firms in the online investing market to choose from and selecting a trusted broker is the number one priority. The platforms do have similar layouts and functionality, but it is recommended to try them out in demo format beforehand. That way, you can find a best-fit for you and a broker with the MFI tools and charting package that get your trading off to the best possible start.


