Apple’s stock has been incredibly popular with investors, partly due to it being in a particularly attractive sweet spot. With some of the characteristics of a growth stock, but also paying dividends, Apple stands out amongst the crowd.
The dividing line between growth stocks and income stocks is somewhat blurred. Typically, it requires investors being forced to choose either potential capital gains from backing a promising new prospect or a steady income stream generated by a less exciting but more reliable business. With Apple, as many investors can happily state, things are different.
How Much Does Apple Pay in Dividends?
The firm paid its first dividend to shareholders as far back as 1987. This was at the time when it was in a significant growth phase and could have been expected to hold onto any spare cash on its balance sheet to finance exciting new ventures.
That 1987 dividend saw holders of AAPL stock receive six cents for each share they owned. Shareholders then continued to receive payments at the end of every financial quarter until 24th November 1995. The payments then stopped for 17 years and only resumed when Apple paid a $2.65 dividend on each share on 24th July 2012.
From 2012 to the current day, Apple has returned to the habit of paying quarterly dividends. However, the amount of cash returned to investors has declined, with the payment made on 15th August 2024 being a relatively modest $0.25 per share.

You can find the Apple dividend history stretching all the way back to 1987 here. As you can see from the image above, the amount per share has not changed significantly, but as the AAPL stock price has continued to appreciate, the yield has in fact been declining, as you can see in the section below.
Apple Dividend Yield Over Time
The face value amount of a dividend payment is important, but representing it as a percentage of the underlying share price throws up the dividend yield number. A small dividend payment ($1) on a low-priced stock ($10) can, in percentage terms, be a better return than a more significant dividend ($5) on a higher-priced stock ($100).
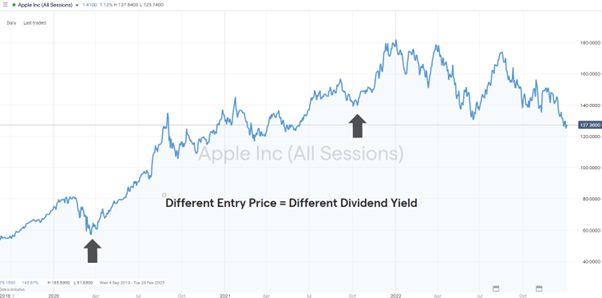
Apple Yield Variance Example – Taking the last three dividends of 2021 (all of $0.22), investors who bought AA19PL stock for $57 in March 2020 locked in a better dividend yield than those who bought AAPL at $142 in October 2021.
Over the last 10 years, the average yield on Apple stocks has ranged from 0.58% to 2.10%, which doesn’t put them in the same category as outright dividend stocks. It does represent a nice-to-have return that has been above bank savings rates for much of that time and is better than some of AAPL’s competitors. It also runs in parallel to the phenomenal capital growth over the same period, with Apple stock moving from the region of $16 to $180 per share.
Why Did Apple Stop Paying Dividends?
Between 1995 and 2012, Apple’s management decided that retaining profits and investing in new projects would be more beneficial for the firm (and its shareholders) than returning cash in the form of dividends.
In hindsight, this appears to have been the right call. Those new projects included the rollout of iPhones, iPods, iPads and Apple Music, which resulted in shareholders benefiting from capital gains as AAPL shares rose by more than 12,700% in value.
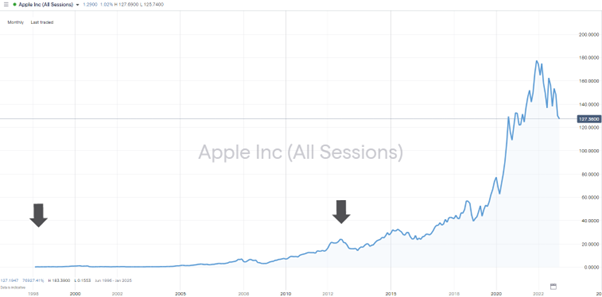
The decision taken by the firm in 2012 to resume paying dividends can be seen to have not impacted the rate of growth in AAPL stock. Between 2012 and 2023, the share price increased in value by more than 500%. This doesn’t quite match the phenomenal returns of the 1980s, 1990s and 2000s, but reflects the firm and the sector it operates in maturing rather than the firm bleeding cash to investors.
How Often Does Apple Pay Dividends?
The decision on whether to pay a dividend, the amount and the exact date of payment is at the discretion of the firm’s senior management. Apple pays all its dividends in cash form and every quarter.
Clarification of exactly when Apple pays dividends involves keeping up to date with market reports and company announcements.
Some companies offer shareholders the option of taking dividends in the form of additional shares of approximately equal value to the cash payout. While Apple doesn’t offer a scrip or DRIP (dividend reinvestment plan) option, firms on this list of well-regarded brokers allow clients to automate the process and convert the Apple cash payment into more Apple stock.
Price charts show a dramatic long-term increase in the value of Apple stock, but reinvesting dividends would have resulted in even more impressive returns. Not only did those stocks rise in price by an amount greater than the cash payout, but at the next dividend date, they would have also been recorded as being eligible for dividends themselves.
Previous performance isn’t a guide to future share price activity, but this snowballing of assets is associated with the most impressive and sometimes exponential stock market returns over the past decades.
Apple’s Cash Pile
Apple’s dividend payments come about thanks to the firm’s incredible profits. Apple revenue for the 12 months ending 30th September 2022, was $394.32bn, which was a year-on-year increase of 7.9%. The firm’s annual free cash flow for 2022 was $111.44bn, a 19.89% increase from 2021.
As such stellar returns have been posted for many years, the firm is sitting on an impressive cash pile. The Q2 financial reports of June 2022 show that cash and short-term investments total $48bn, and as recently as 2019, that figure exceeded $100bn.
The spare cash on hand has become a major talking point among Apple investors. It demonstrates the success of the firm, but some provide a counter-argument that it could be bad for the long-term prospects of the company.
One long-standing theory is that companies that hoard cash underperform those that don’t. This theory has been promoted by Michael Jensen, an emeritus professor of business administration at Harvard Business School who claims that it encourages management teams to make poor decisions.
The claim is backed up by data that shows that corporate earnings growth over 10-year periods between 1871 and 2001 grew the fastest at firms that had the highest dividend-payout ratios.
Apple investors, or those considering making the decision to buy Apple shares, might be glad to note that the amount of free cash is declining. In the last two and a half years, the cash pile has halved.
This points to dividends at Apple being likely to hold up, and that represents a monetary gain for shareholders. At the same time, it could encourage the firm to refocus its efforts, improve its operations, and thereby return additional rewards to investors in the form of AAPL share price growth.
So far, the programme is going according to plan. Cash and short-term investments fell by 55% between the end of 2019 and August 2022, and over the same time period, return on equity jumped to 163% from 55%. This represented a 35.3% annualized total return for Apple shareholders that was more than three times the average for the S&P 500 index over the same time.
Apple and Stock Buybacks
Stock buybacks are the process where a firm’s management takes the decision to use spare cash to buy their company’s shares on the open market and then take them out of circulation. Buybacks benefit shareholders thanks to the reduction in the total amount of stock supply being reduced. Following the laws of supply and demand, the price of the remaining shares increases.
Apple bought back almost $90bn worth of its own shares in the fiscal year up to September 2022. This represents a scaling up of the buyback programme, which over the past six years has seen more than $420bn of stock bought back. The plan to decrease the number of outstanding shares feeds into the earnings per share (EPS) and forms another way for investors to benefit from AAPL stock capital growth.
Apple Dividends vs Apple Stock Buybacks
Buybacks and dividends have respective pros and cons in terms of taxation. The exact T&Cs depend on individual circumstances, but investors who pay tax on dividends received as income might prefer Apple management to engage in more stock buybacks. The net gain from the share price being supported should be in line with what would be paid out in dividends, just without the tax deduction.
Other investors who can reduce their tax bill on dividend payments but would pay tax on capital gains caused by buybacks would take the opposite view of which approach they want Apple management to take.
Apple Dividend History
The below table offers a granular breakdown of Apple dividends over time. While the firm continues to dominate the tech-stock sector, there appears little reason for the schedule to be dramatically altered.
Investors considering investing in Apple can take comfort in the fact that the dividends and other corporate actions that the firm is engaging in look set to provide continued support for the AAPL stock price, and a passive income.
Apple Dividend History – 2019-2023 (dividend amounts not split-adjusted)
* Reflects first date shares trade on a split-adjusted basis.
Final Thoughts
Corporate actions and dividend policies might not at face value appear to be the most exciting element of stock research and analysis. As Apple’s dividend history illustrates, literally following the money can offer an insight into the broader prospects of a firm.
If Apple’s renewed appetite for paying dividends has resulted in you deciding to buy the stock for the first time or top up an existing position, it is crucial to pick a broker that has the tools and resources to help you keep track of how Apple dividends are paid.
Your broker will process most of the accounting transactions in the background, which means that you won’t have to take time reconciling accounts. Where brokers do differ is in terms of the calendars and tables that they provide to help you navigate future corporate actions.
This list of trusted brokers includes firms that have been reviewed by the AskTraders team to ensure that they offer a level of service that will help your trading get off to the best possible start.