Digging into the detail of what the phrase ‘bull market’ actually means, how to identify them, and how to trade them is a great first step into the markets and making your money work harder for you.
What is a Bull Market?
There are two widely used definitions of a bull market. They can be applied to any asset group, whether that is forex, commodities, cryptos, bonds or, as is commonly the case, equities. These are circumstances when:
- Prices rise by at least 20% from the previous low
- Prices rise to record a new all-time-high
Some bull markets will meet both conditions, some only one. As markets don’t move up in a straight line, there will be dips in price along the way as well.
Nasdaq 100 Index Bull Market
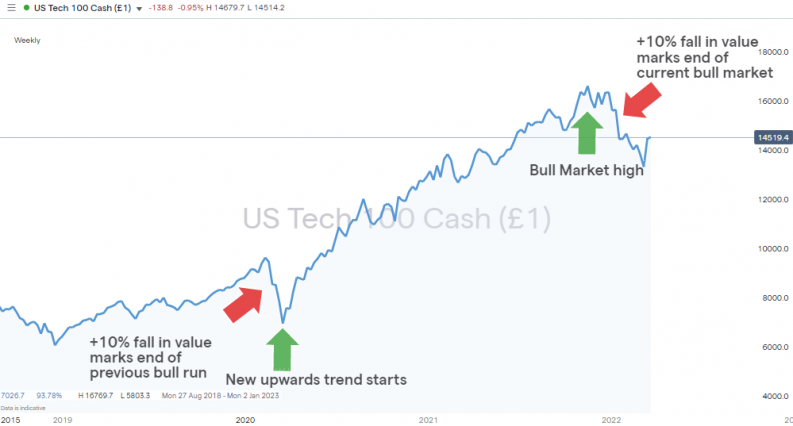
Source: IG
It’s also worth noting that the phrase ‘bull market’ is often used to reflect market mood. If, for example, a stock index has increased by 10% and has shown significant upwards momentum over a short period of time, then the bullish sentiment might result in commentators and investors describing it as a bull market. This would be despite it not posting a +20% increase and not making all-time highs.
Getting too caught up in the definition and waiting for that all-time-high, or 20% trigger, could work against you. Spotting trends early is always a good idea and when the term ‘bull market’ is being used extensively, it’s a sign that not only have prices already risen but that they are expected to continue doing so.
How to Spot a Bull Market
Part of the reason that equity markets are often associated with the term bull market is that stocks have historically shown a tendency to rise in value. The ‘norm’ is for prices to rise gradually over a long period with infrequent and sudden crashes along the way. This is unlike the forex or commodity markets, which have less of an underlying bias and where prices show a greater willingness to go down as well as up.
As long as the market continues to print higher-highs and higher-lows the bull market trend will be maintained. There are few certainties in the market, but one is that all trends ultimately come to an end. In the case of bull markets, this occurs when the price in the market drops by 10% or more from the previous high. A downwards move of 10% is known as a ‘market correction’ and a price crash of 20% or more is referred to as a ‘bear market’.
How Long do Bull Markets last?
As the parameters used to measure a bull market are simply time and price, they can last for any length of time – but equity bull markets tend to be several years in duration. This is an important consideration as it’s not necessary to be involved in a bull run right from the start to make returns. The old adage used by experienced investors is to ‘join the party late and leave it early’.
Equity Bull Markets Through History
March 2009 – February 2020 – Sustained and long-term recovery of the economy and global financial system following the Great Recession. S&P 500 Index up 416%.
Oct 2002 – Oct 2007 – Global expansion fuelled by the housing boom and easily accessible debt. S&P 500 Index up 97%.
Oct 1990 – March 2000 – The end of the Cold War, emergence of BRICS economies, and the dawn of the internet age led to transitional change and new markets opening up. S&P 500 Index up 401%.
S&P 500 Index Bull Market – 1990-2000
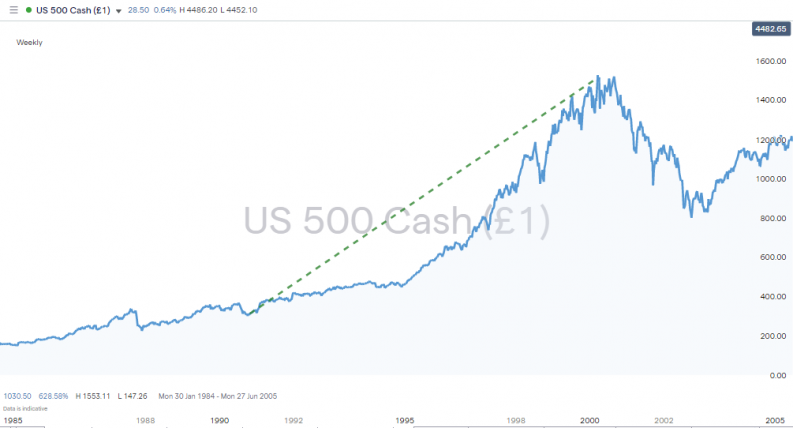
Source: IG
Why do bull markets end?
Unfortunately, there’s no hard and fast rule on why bull markets end. If there were, then all traders would be retiring early. Each of the above bull runs were followed by price crashes of more than 10% due to different and specific factors that marked the end of the market overextending and being ‘overbought’.
February 2020 – The COVID pandemic hit the stock markets at a point where they were already considered by many to be frothy. The unprecedented challenges of the pandemic and global lockdowns caused panic across the markets and resulted in the S&P 500 index falling 35% in value during the period between 19th February and 22nd March.
Oct 2007 – A decade of cheap and easily accessible mortgages created a housing bubble, which simply burst when house prices began to soften. A cascade of defaults broke the financial system. It resulted in the S&P 500 index recording its biggest ever fall between October 2007 and March 2009 – the index gave up 57% of its value.
March 2000 – Internet stocks, which fuelled this bull run, found it harder to justify their sky-high valuations. After a period of traders buying stocks just because they were going up, a correction took place, which coincided with the ‘millennium bug’. The resulting price crash in the S&P 500 index wiped off 49% of market value between March 2000 and October 2002.
The Best Strategies For Trading a Bull Market
The nature of bull markets means that ‘chucking on a position’ can result in a positive return, but adopting one of the below tried and tested trading strategies for bull markets can help you optimise your trade entry and exit points.
Bull Market Trading Strategy 1 – Averaging Into Positions
One of the benefits of using an online broker is that fierce competition in the sector has driven down trading costs. Many of the good brokers such as eToro and IG typically invariably don’t charge commissions on equity or index trades. Instead, they make their revenue on the difference between buying and selling price – the bid-offer spread.
This makes trading in small size cost-effective. Even if you have a small total amount of cash available, you can buy into the market in small increments and average out your trade entry point over time. This can be done while the market is falling – but you expect it to turn, or when it’s rising, when you’d hopefully be building on winning positions to maximise profits.
Bull Market Trading Strategy 2 – Breakout
Breakout strategies aim to get around the problem of identifying when a bear market or correction ends, and when a new bull market begins. Buying into a downwards moving market can be like catching a falling knife and a lot of inexperienced traders enter trades too early in an effort to pick the very bottom of a market.
S&P 500 Index – Breakout Trading Strategy
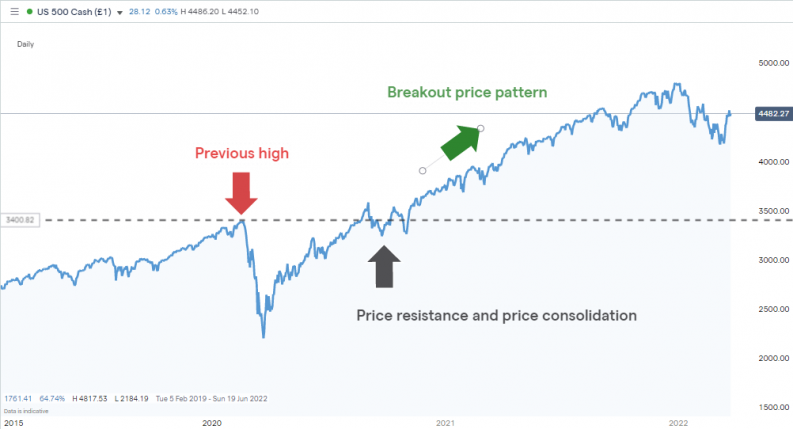
Source: IG
Given that bull markets can run for years, waiting for confirmation in the form of a breakout signal can still result in positive returns, but with less of the downside risk. After the outbreak of COVID in Q1 2020 the S&P 500 index fell in value by 49% but by August had rebounded to 3,400 – the region of the previous price high recorded in February of that year.
Price then consolidated at that level and investors considered whether the bad news had been already priced in and if vaccines offered a way out of global lockdown. As market sentiment turned increasingly positive, the price of the index broke out to the upside. Between November 2020 and December 2021, it shot up in value by a further 39.15%.
Bull Market Trading Strategy 3 – Momentum Indicators
Momentum trading is based on the premise that once prices have begun to steadily and reliably increase, then they invariably will continue in the same direction in the near future. Price charts offer a clue to a trend forming – if the price line is heading upwards from the bottom left-hand corner to the upper right-hand one, you’re likely to be watching a bull market. Other technical indicators that are provided free of charge by high quality brokers can be used to double-check how strong momentum is. These other metrics include:
- RSI (Relative Strength Index)– Developed by J. Welles Wilder, the RSI burst onto the scene in 1978 and has since helped traders process historical price data through a clever formula that identifies if momentum in a market is likely to hold, build or decline.
It can be set to different time frames. So, a market might be ‘overbought’ on a daily basis and due for a short term sell-off, but ‘oversold’ on a longer time frame and due to post future price rises. Such a scenario would indicate a buying opportunity is due to arise for those who believe a bull market is in progress and who are ready to buy into the next pullback.
- Heiken Ashi Candlesticks– This strategy allows traders to monitor momentum using price candlesticks that have been customised to filter out market ‘noise’. Just viewing the length of the wicks and the colour of the candle bodies can offer an indication of the strength of a current trend and if it is likely to continue.
The monthly price chart for the S&P 500 index shows that since 2016, a green / upwards Heiken Ashi candle after a market correction is followed by a sustained and long-term rise in prices.
S&P 500 Index – Heiken Ashi Momentum Trading Strategy & RSI
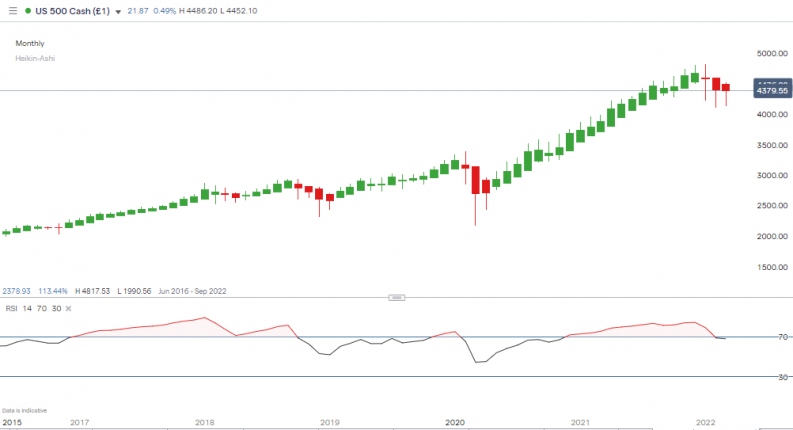
Source: IG
Is a Bull Market About to Start?
A massive market sell-off in the first quarter of 2022 has resulted in a correction, which marked the end of the 2020–2022 bull market. While sentiment remains mixed, current market conditions do present an opportunity to those looking to put on strategies that make the most of increased market volatility.
At the time of writing, the monthly Heiken Ashi candlestick chart is yet to post a green candle. Using that metric, a bull market is yet to be confirmed. But while a rebound and the formation of a new bear market might be hard to time exactly, the formation of a new bull market is inevitable. Those with a positive outlook will already be averaging into positions and seeing the current sell-off as a buying opportunity using analysis such as this report on how to trade a market sell-off.
How to Trade the Next Bull Market
It’s also worth remembering that a bull market is a term that is usually used to describe the broader market, but some individual stocks and sectors will outperform and underperform when compared to the market average.
If you want to pick some buy-and-hold stocks in the green energy sector, then this review of the best renewable energy stocks to buy now is a good place to start. Other industries poised to boom in the next bull market are these bio-tech penny stocks and these EV stocks, which are an alternative to Tesla.
Final Thoughts
Bull markets hold a special place in the investment community. There is a feeling that anyone can make money by picking nearly any stock, and to some extent, that’s true. Optimising returns requires more thought and it’s important to remember that ‘the bend is your friend until the turn at the end’. All bull markets do ultimately run out of steam.
The tools required to run technical and fundamental analysis on markets and to draw your own conclusions are freely available at good online brokers. Navigate to one of these trusted brokers and you’ll find buying into the next bull market is a user-friendly and cost-effective process. Setting up an account and putting on trades can be done in a matter of minutes. After that, it’s a case of buying in at the right time and betting on the next bull market generating returns in the same way previous ones have.


