The question often asked is, ‘Can I make a living day trading?’ Getting an understanding of how intraday strategies work can help get some way towards answering it.
- Intraday Strategies Explained
- Strategies and Signals to Use With Intraday Trading
- The Role of Internet Chat Rooms
- Which Markets and Stocks are Good for Intraday Trading Strategies?
- Intraday Trading Strategies Using Chart Patterns – Case Study – Tesla
- Advantages of Using Intraday Trading Strategies
- Disadvantages of Using Intraday Trading Strategies
- The Bottom Line
Intraday Strategies Explained
One of the easiest ways to get to grips with intraday trading is to set up a demo account and practice trading virtual funds. Trading dashboards for demo accounts have the same functionality as those for live accounts, so the experience is the same as with trading real cash, except that demo accounts are risk-free. Intraday trading is very much about trading markets in real time. It requires positions to be closely monitored and is one for those who are looking to be active traders.
Intraday Strategy Trading Frequency
High-volume trading is the name of the game with intraday strategies. The trick is to get into a position, ride a short-term trend, and close out a position before the market closes. Positions can be held for minutes or hours, and some traders hold them overnight. However, purists would say that day trading is typified by all trades being exited by close of business.
Apple Inc. Share Price Chart 15-Minute Intervals – Spike in Trading Volume at Market Open & Close
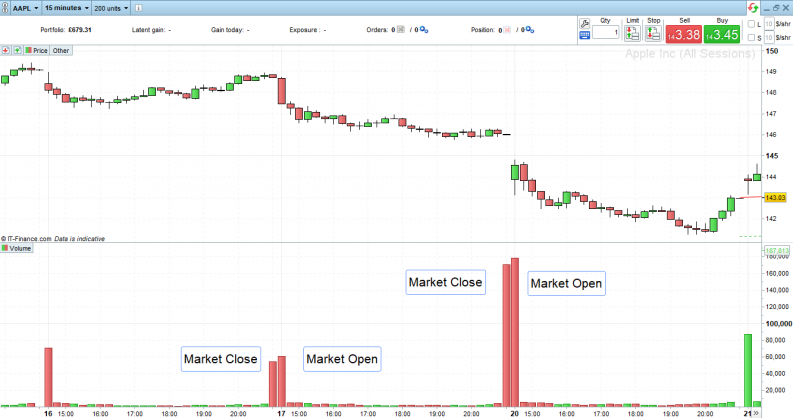
Source: IG
Ocado Plc Share Price Chart 15-Minute Intervals – Spike in Trading Volume at Market Open & Close
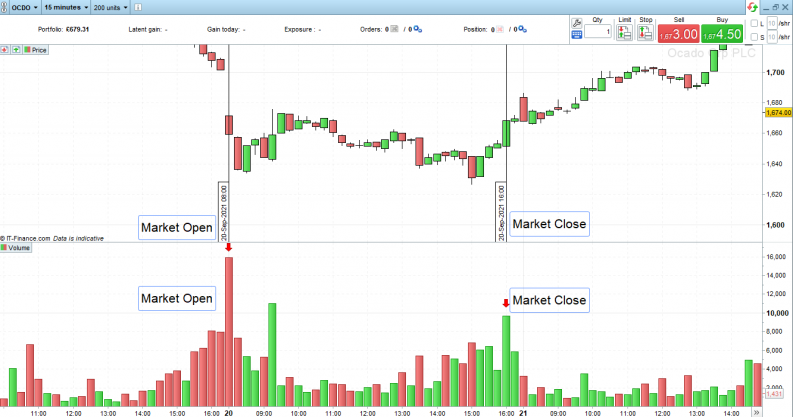
Source: IG
Intraday Strategy Trade Entry and Exit
There are traditionally busier periods of the day. Markets tend to see peak flow in the 15 minutes after market open and the 15 minutes before market close. This marks the time that traders and big institutions rush to get into and out of positions. Other peaks in trading activity can occur when another exchange around the world opens. For example, European exchanges see peak volume at open (8am UK time) and close (4:30pm UK time), but also get busier when the US exchanges open (2:30pm UK time).
Major news announcements, such as central bank interest rate announcements or US jobs figures (1:30pm UK time on the first Friday of the month), can also be put in the diary as moments when price volatility can be expected to pick up.
Intraday Strategy Risk Management
As intraday positions have only a limited time to come good, there is a focus on ensuring that any loss-making positions are cut sooner rather than later. Stop-loss limits tend to be tighter than for strategies that run over a longer timeframe and trailing stop-loss tools can be used to ensure that any positions that start making a profit don’t become loss-making should the trend reverse.
Apple Inc. Share Price Chart 15-Minute Intervals – Trade Entry Point & Stop Loss
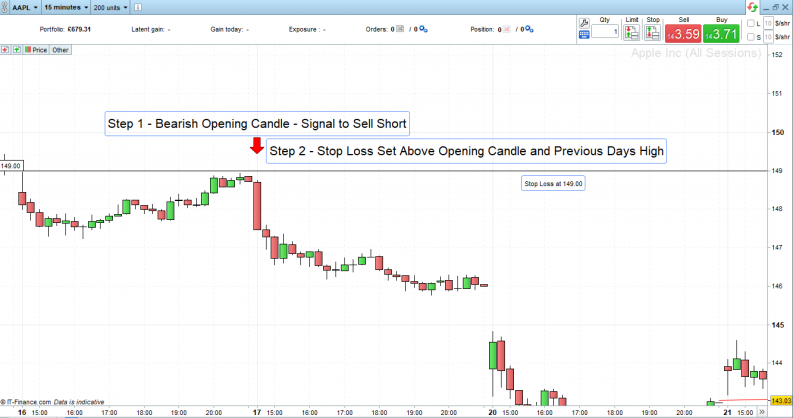
Source: IG
Intraday Strategy Win-Loss Ratio
With a relatively large number of trades being placed, the win-loss ratio becomes an important consideration. If individual trades have a gain to loss ratio of 2:1, then a portfolio of trades where the win-loss ratio is 50/50 would be a profitable one. Intraday trading is very much a numbers game, with no time to fall in love with any particular positions.
Strategies and Signals to Use With Intraday Trading
Some strategies are better suited to intraday trading and are outlined in the below case study, which follows a trade in Tesla. Intraday trading is more about a style of trading rather than any particular technique being used. Any strategy that works and involves high-frequency, short-term trading can be applied to intraday trading.
- Swing Lows
- Money Flow Index
- Volume Weighted Average Price
- Moving Averages
- RSI
- Trading Volume Strategies
- Fibonacci Levels
- MACD
The Risks of Selling Short Intraday
Beginners in particular would do well to practice short selling on a demo account before using real cash. The phenomenon known as a ‘short squeeze’ is particularly hazardous as price can rise further than it can fall. Put another way, on long positions, your losses are limited to the stake you place. As upward movement can technically be infinite, losses on short positions can be extreme. The use of stop losses on short positions is crucial to avoid fear creeping into trading decisions.
GameStop Corp Share Price – Intraday Price Rise of 77% on 27th January 2021
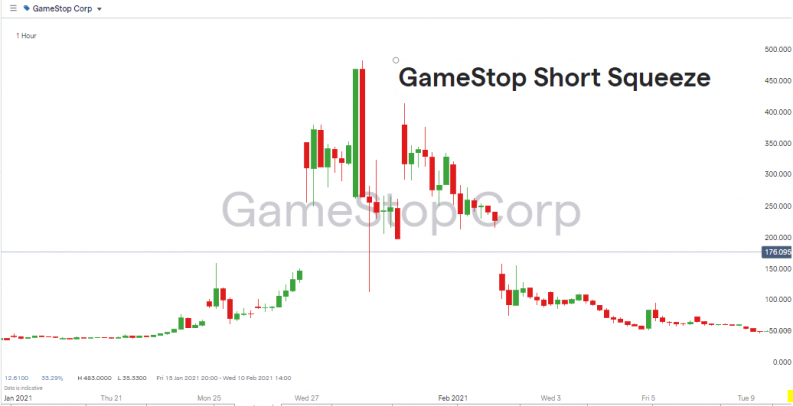
Source: IG
The Role of Internet Chat Rooms
The popularity of intraday trading and the way that retail investors often work alone and from home has led to a range of internet chat groups forming. Tapping into the ideas of other traders can be a great way of crowdsourcing what markets are hot and also what the sentiment is among day traders. To trade with the trend, you have to know what it is, and these resources are a great way to try to do just that.
Meme Stocks
One offshoot of the online information sharing by day traders are meme stocks such as GameStop. Stocks with extreme price volatility offer high risk-return, and when they form a battleground between retail and institutional investors, they can hit the mainstream media, which causes increased interest.
Broker Selection
Getting set up with the right platform is particularly important for intraday traders. It’s crucial that the trading platform has all the tools needed for effective trading. Some of the best brokers have developed powerful software tools specifically designed to help those who trade that way. It is also important to consider which brokers to avoid. In early 2021, some brokers restricted access to certain meme stocks. While the explanation given was that this was to ‘protect’ their clients, many saw it as a way of extinguishing retail interest in a market in favour of institutional investors who were losing money.
Which Markets and Stocks are Good for Intraday Trading Strategies?
Picking the right market is more important in intraday day trading than it is for some other strategies.
Intraday Trading on Equity Exchanges
The approach first developed at stock exchanges because these open and close each day. Because the time when the market is shut is longer than the time it is open, news events that occur overnight aren’t priced in until the market opens again. That moment is when buyers and sellers realign their portfolios based on what the new day brings, and as a result new trends are formed.
Intraday Trading on Non-Equity Markets
Other markets trade on a 24/5 basis and no official daily open and close, but they do have natural peaks and troughs in volumes. It is still possible to trade markets such as the Nasdaq index, crypto, commodities and forex using intraday strategies, even though the open and close is unofficial in nature.
Monitoring futures indices that do trade overnight is very much a key part of day trading, even if you don’t trade those futures. Upward or downward movement in an ‘around the clock’ instrument gives an indication of which way stocks will move to catch up when the exchange opens. If the Nasdaq index is up 1% overnight, when that exchange opens, the tech stocks that form the index are likely to rally in price.
Intraday Strategies for Trending Markets
The majority of intraday trading activity focuses on spotting trends. The aim is to catch a ride on a price move based on buying or selling pressure that built up overnight.
Intraday Strategies for Ranging Markets
Sideways trading markets with distinct trading ranges offer a different proposition. Some intraday traders run strategies that buy at the bottom of the range and sell at the top. This is done using indicators such as support and resistance lines, and allows traders to trade both ways.
Intraday Trading Strategy Stock Selection
Choosing the right market is crucial. If you’re running trend-following strategies, then trading a range-bound market will rack up losses. It’s also worth building a database of stocks that outperform the market average in bullish markets and those that overextend to the downside when markets plunge. These high-beta stocks offer the medium-high price volatility that is needed to be able to make a profit in a short period of time.
Liquidity
Liquidity is a key concern. Increased amounts of trading activity are associated with tighter trading spreads, which makes trading more cost-effective. It’s also important to avoid getting stuck in a position.
Intraday Trading Strategies Using Chart Patterns – Case Study – Tesla
Tesla stock is a popular target of intraday traders. Its sky-high and disputable valuation, along with maverick CEO Elon Musk’s willingness to release tweets, mean that trends can quickly form. It has got a huge market capitalisation in the region of $780bn, so is a liquid stock with high price volatility.
Prior to the US exchanges opening, a cross-reference to Nasdaq futures shows that index is slightly up since Tesla stock last traded. There may be Tesla-specific news, which means that it will miss out on this tech-stock rally, but a positive start for Musk’s carmaker could be on the cards.
Nasdaq 100 Index – 30-Minute Price Chart
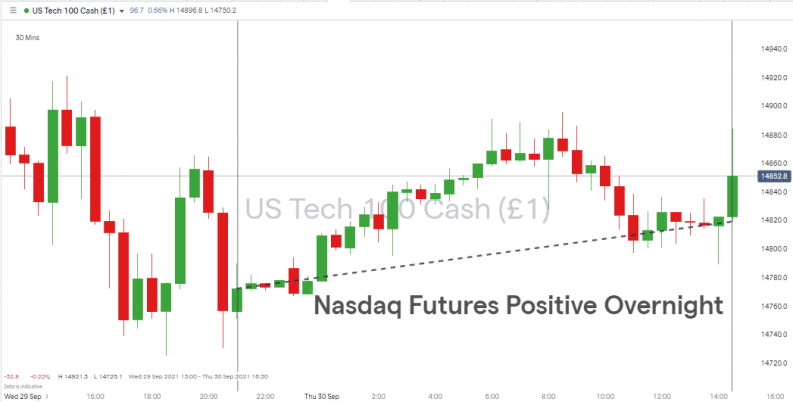
Source: IG
09:30 Eastern Time – The Nasdaq market opens and the aim is to run an intraday trend following strategy using 15-minute candles to determine if the trend is there, and which way it is going.
09:37 – Seven minutes into the day’s trading and trading volumes are spiking, which is to be expected. This is a neutral/positive signal that market conditions are in line. One note to make is that even though we’re only halfway through the 15-minute period, the volumes are higher than the previous day’s open. This could be a day for a big move, so trend strategies do look the preferred option.
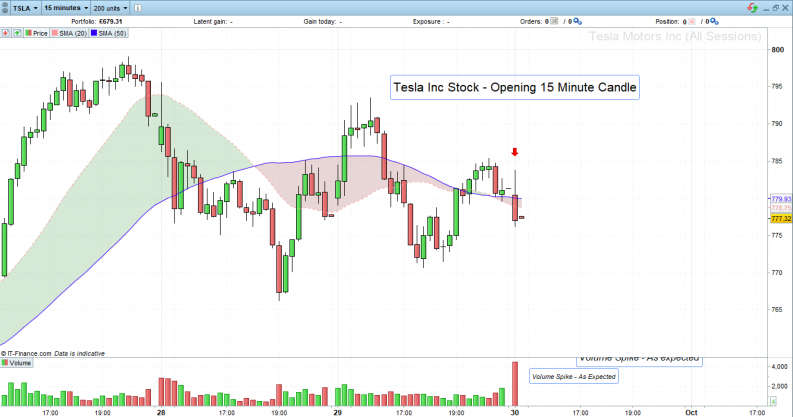
Tesla Share Price Chart – 15-Minute Candles – Market Open Intraday Trade Case Study
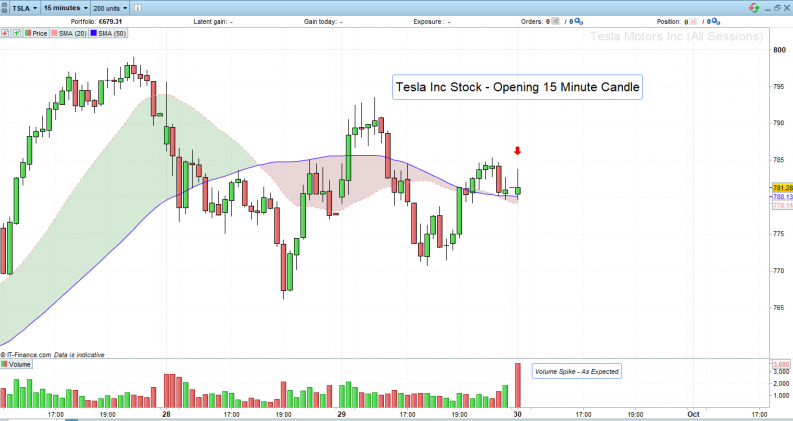
Source: IG
09:41 – With 11 of the first 15 minutes of the session gone, the opening candle has turned bearish (red to green) and now has a long upper wick. It isn’t the most bearish candlestick pattern, but it is definitely pointing to further downside price movement. Given that this is contrary to the overnight move in Nasdaq futures, the decision is to be patient and see how the first 15-minute candle closes. Volumes are still building.
Tesla Share Price Chart – 15-Minute Candles – Market Open Intraday Trade Case Study
Source: IG
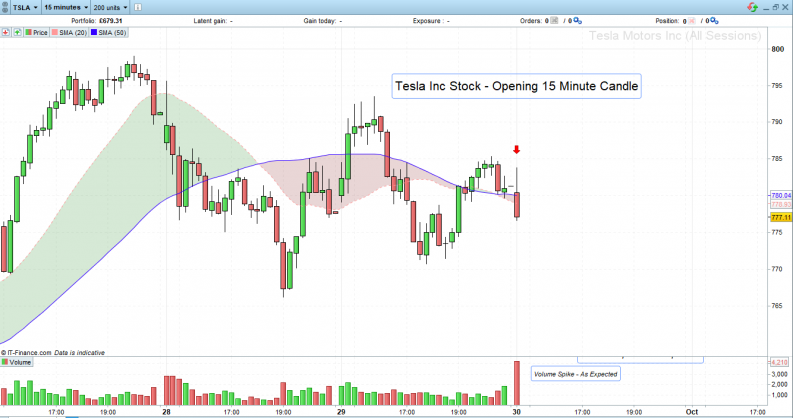
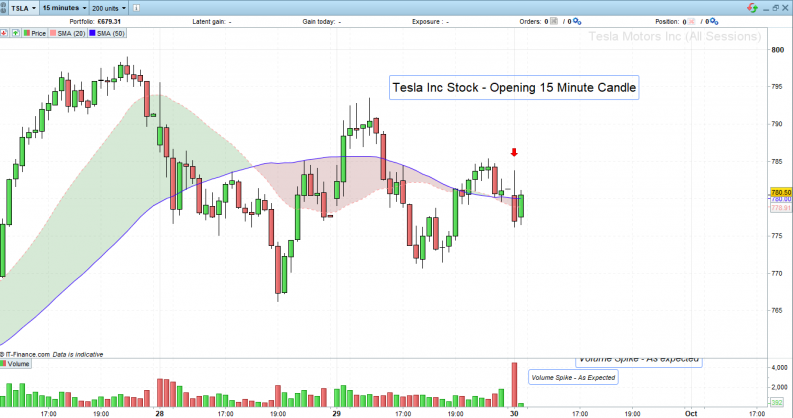
09:46 – The first 15 minutes of trading have finished and the next 15-minute candle has opened within the body of the previous candle.
Further downward movement and price breaking lower than the close or low of the first 15-minute candle would be a signal to sell short. The 15-minute 20 SMA (blue line) is currently above price levels and will form resistance to upward movement. A stop loss set above the SMA, the market opening price, or high of the day could be an option, but the downward move needs to be confirmed.
Tesla Share Price Chart – 15-Minute Candles – Market Open Intraday Trade Case Study
Source: IG
09:47 – The Nasdaq as a whole is in positive territory for the day. The first 15-minute candlestick for the index was green, not red. Any short position in Tesla needs to be backed by strong signals if it is going against the broader market, and those signals haven’t appeared, yet.
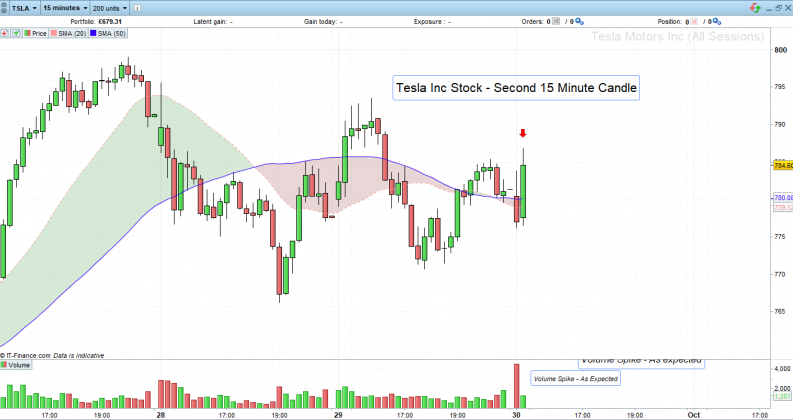
09:52 – Seven minutes into the second 15-minute time interval and price has rallied. Trade volume has dropped off, suggesting that a move to the upside could be about to take place. The high volumes point to a lot of buying power just being triggered at $777.60. If big institutions and ‘real money’ are buying, then those are the people to follow.
Tesla Share Price Chart – 15-Minute Candles – Market Open Intraday Trade Case Study
Source: IG
09:54 – Bulls are in the ascendancy. Price has now printed a new daily high.
Tesla Share Price Chart – 15-Minute Candles – Market Open Intraday Trade Case Study
Source: IG
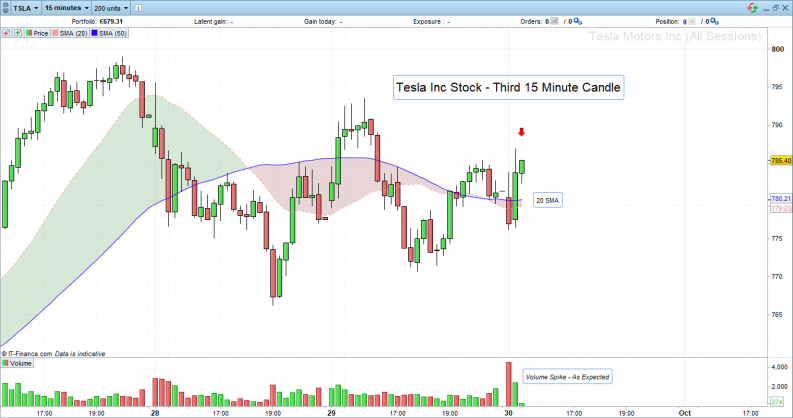
09:56 – Near the closing minutes of the second 15-minute period, volumes picked up and we now have two tall candles in the volume monitor. It looks like there is a groundswell of buying pressure building, or possibly more accurately, selling pressure has eased. The Nasdaq index is still reporting that both of its 15-minute candles are positive.
Tesla Share Price Chart – 15-Minute Candles – Market Open Intraday Trade Case Study
Source: IG
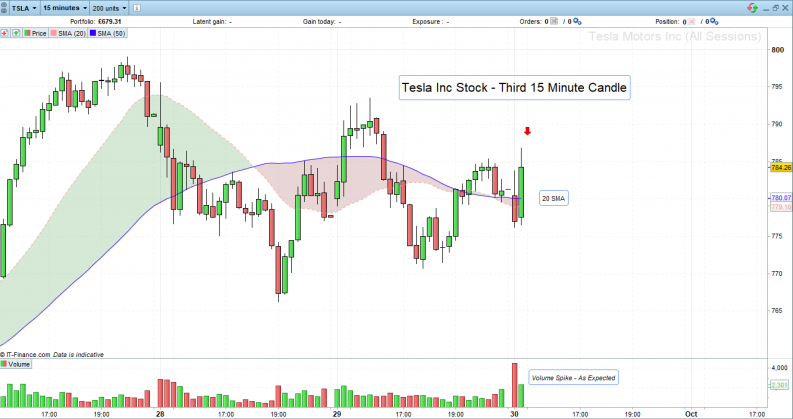
The uptick in volumes is the confirmatory signal that we’ve been waiting for. A pullback near to the 20 SMA could provide a long entry point for those who want to get involved as soon as possible.
When that happens, we enter into a long position on the back of a price pullback, which enables us to set a stop loss just below the 15-minute 20 SMA.
Stop-loss limits option two: the more aggressive strategy would be below the low of the day – currently 776.20.
10:01 – The second 15-minute candle has closed. Price action still looks bullish, and the close of the second candle at 783.74 was just below the high of the first candle, which was 783.81. It would have been reassuring if the second candle had closed above the high of the previous one, but we’re still showing a profit.
Tesla Share Price Chart – 15-Minute Candles – Market Open Intraday Trade Case Study
Source: IG
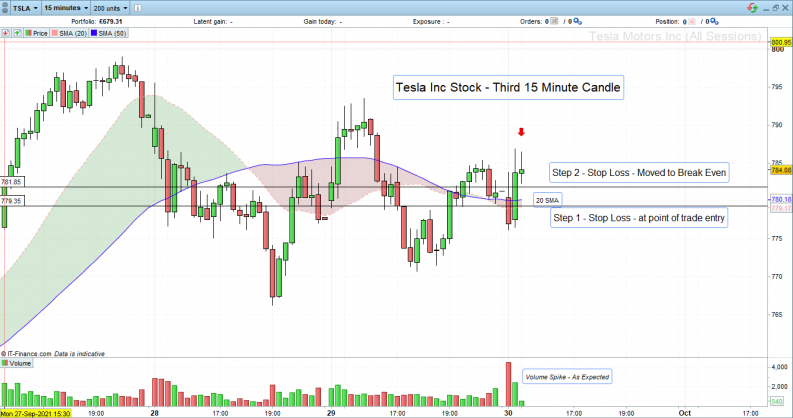
The below chart shows how moving the stop loss up to the trade entry point means that we’re now in a risk-free trade. If there is going to be enough market momentum to help drive price higher, then now is the time. If that doesn’t materialise, we break even. Sometimes the best trading decisions involve the trades you don’t do, and holding off from going short in the first 15-minute period has avoided incurring a loss. It also proves the value of cross-referencing to other indicators – in this case, the Nasdaq, as at the time, the signals relating to Tesla were decidedly bearish.
Stop-loss limits option two: a more aggressive strategy would be to keep the original stop-loss level just below the 20 SMA.
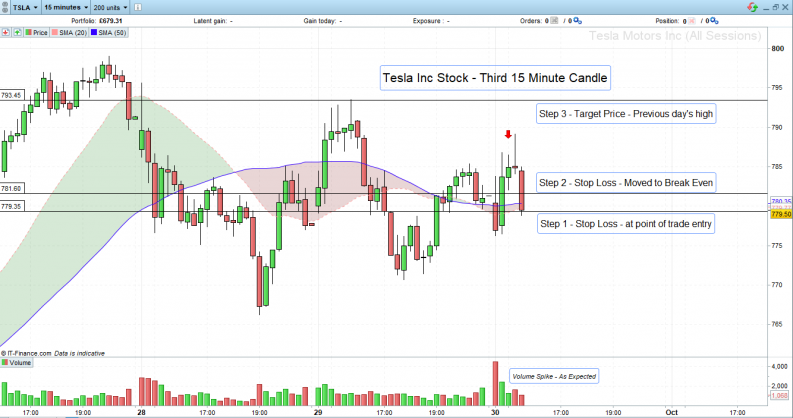
Tesla Share Price Chart – 15-Minute Candles – Market Open Intraday Trade Case Study
Source: IG
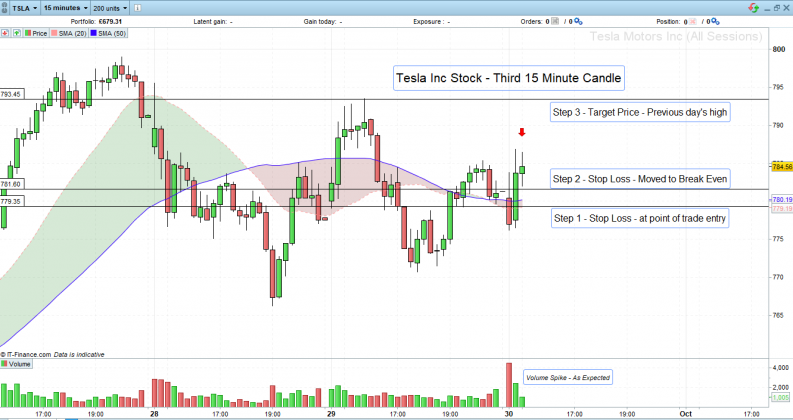
The target price includes the previous day’s high of $7,893.35, which will offer significant resistance.
Tesla Share Price Chart – 15-Minute Candles – Market Open Intraday Trade Case Study
Source: IG
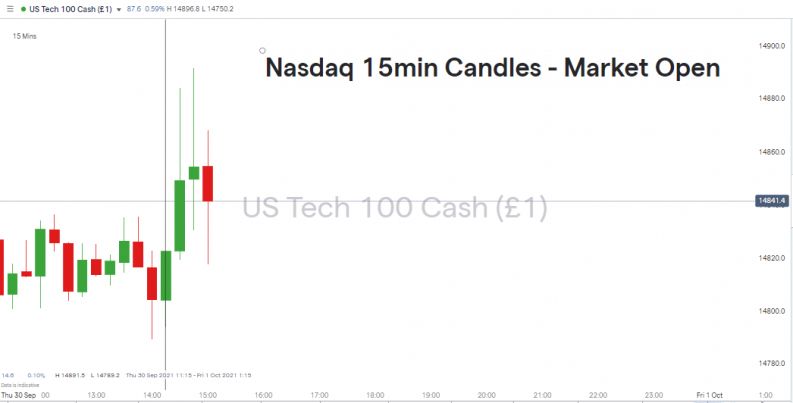
10:13 – The third 15-minute candle for the Nasdaq in the below chart is showing bearish price action. As the index was a leading indicator for the Tesla trade, we decline the temptation to close out the trade and bank some profit. The bearish nature of the first 15-minute Tesla candle weighs against this being a big up day for the stock, but with the stop loss set at break-even, there is limited downside to letting things play out.
Nasdaq 100 Index – 15-Minute Price Chart
Source: IG
10:44 – Both of the possible stop levels have been breached by a pullback in price. Volume levels have dropped off, making it a good time to take a break and not try to force another trade. Trade review notes point to banking profits earlier being the preferable option, particularly given the bearish signals seen in the first 15 minutes.
Tesla Share Price Chart – 15-Minute Candles – Market Open Intraday Trade Case Study
Source: IG
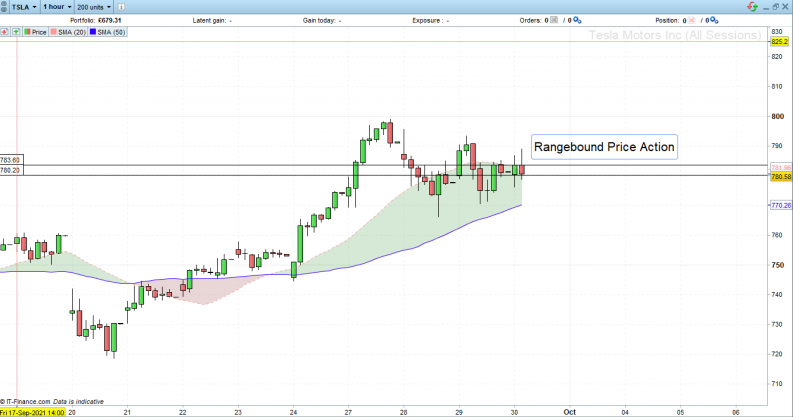
Zooming out to the one-hour price chart and it looks like Tesla is set for a day of range-bound trading. Both of today’s hourly candles are in line with each other and have small bodies compared to those of previous sessions.
Tesla Share Price Chart – One-Hour Candles – Market Open Intraday Trade Case Study
Source: IG
Advantages of Using Intraday Trading Strategies
- Intraday trading can incorporate a wide range of trading approaches. Any successful techniques that fit in with trading in a shorter timeframe can be used.
- Intraday strategies are agnostic to price directions. They can be used in markets that are trending down as well as up.
- The popularity of day trading has led to retail investors finding strength by clubbing together. Online chat groups are great places to pick up new ideas and mean that the workload of researching target markets is shared.
- Price moves in meme stocks can be extreme. Higher volatility equates to higher profits, as long as the trading position is going with the trend.
- Intraday strategies can be applied to any type of asset market.
- Trading in the same direction at the market trend is key to making a positive return. Intraday strategies are based around trend spotting.
- Discipline is a key element of successful trading. Intraday strategies are associated with strict entry, exitand stop-loss limits, which limit the chance of one bad position blowing up an account.
- Good brokers provide a range of powerful tools that have been designed specifically for the market.
Disadvantages of Using Intraday Trading Strategies
- Market conditions such as liquidity levels need to be right.
- If your preference is to trade trend-based strategies and markets are range-bound, there is a need to find an alternative market to trade or to sit on your hands.
- Trading high-volatility markets on a short timeframe is a high risk-return strategy,which might not be for everyone.
- Intraday strategies are high maintenance. It is possible to set up automated instructions such as take profitand stop-loss orders, but they require more engagement than buy-and-hold strategies.
- While technical analysis is at the heart of the strategy, fundamentalfactors can’t be ignored. Shock events that cause sudden price moves can ‘distort’ the day’s trading. News events need to be monitored and Some traders clear down their book prior to scheduled announcements to avoid stop losses being triggered by whipsawing prices, but surprise events can’t be predicted.
- There are variouscommon problems that explain why technical indicators fail.
The Bottom Line
Intraday trading is a fast-moving and intense activity, and traders who make the right calls can make considerable profits in a short space of time. There are, of course, also losers, and one factor to be wary of is that intraday trading can be exciting. Acknowledging this fact is important as successful strategies are those that take as much emotion out of trading as possible.
If market conditions are right, and your broker is set up to provide good market access and cost-effective pricing terms, then any strategy that works can be applied.
Further Reading
- A beginner’s guide to day trading can be found here.
- Develop the skills required to be successful using intraday trading by visiting this educational area of the AskTraders site.
- More details on how to trade the opening range using intraday chart patterns can be found here.
- Active traders who want to run one-minute scalping strategies using intraday can learn more about that here.
- Trading with the trend is the secret to successful investing, and ways to use intraday to understand trends are outlined here.
- If you’re thinking of entering into the intraday market, this report on the best trading platforms for day trading will help with broker selection.
- Understanding how meme stocks come about can help when trading these popular and high-volatility markets.
- This list of the top 10 Reddit traders offers access to internet chat rooms where day traders share ideas on their next target.


